The Types of Marketing Professionals: A Field Guide for CEOs and the People Who Work With Them
September 2, 2026

This one-page marketing plan guide was originally published February 2020. Updated September 2026.
A one-page marketing plan exists for one reason: most marketing plans get read exactly twice. Once when they’re presented, once when someone digs them out of the shared drive to prove a point in an argument. In between, nothing.
That isn’t a thinking problem. It’s a format problem. Nobody opens a forty-slide deck on a Tuesday morning to decide what to do next.
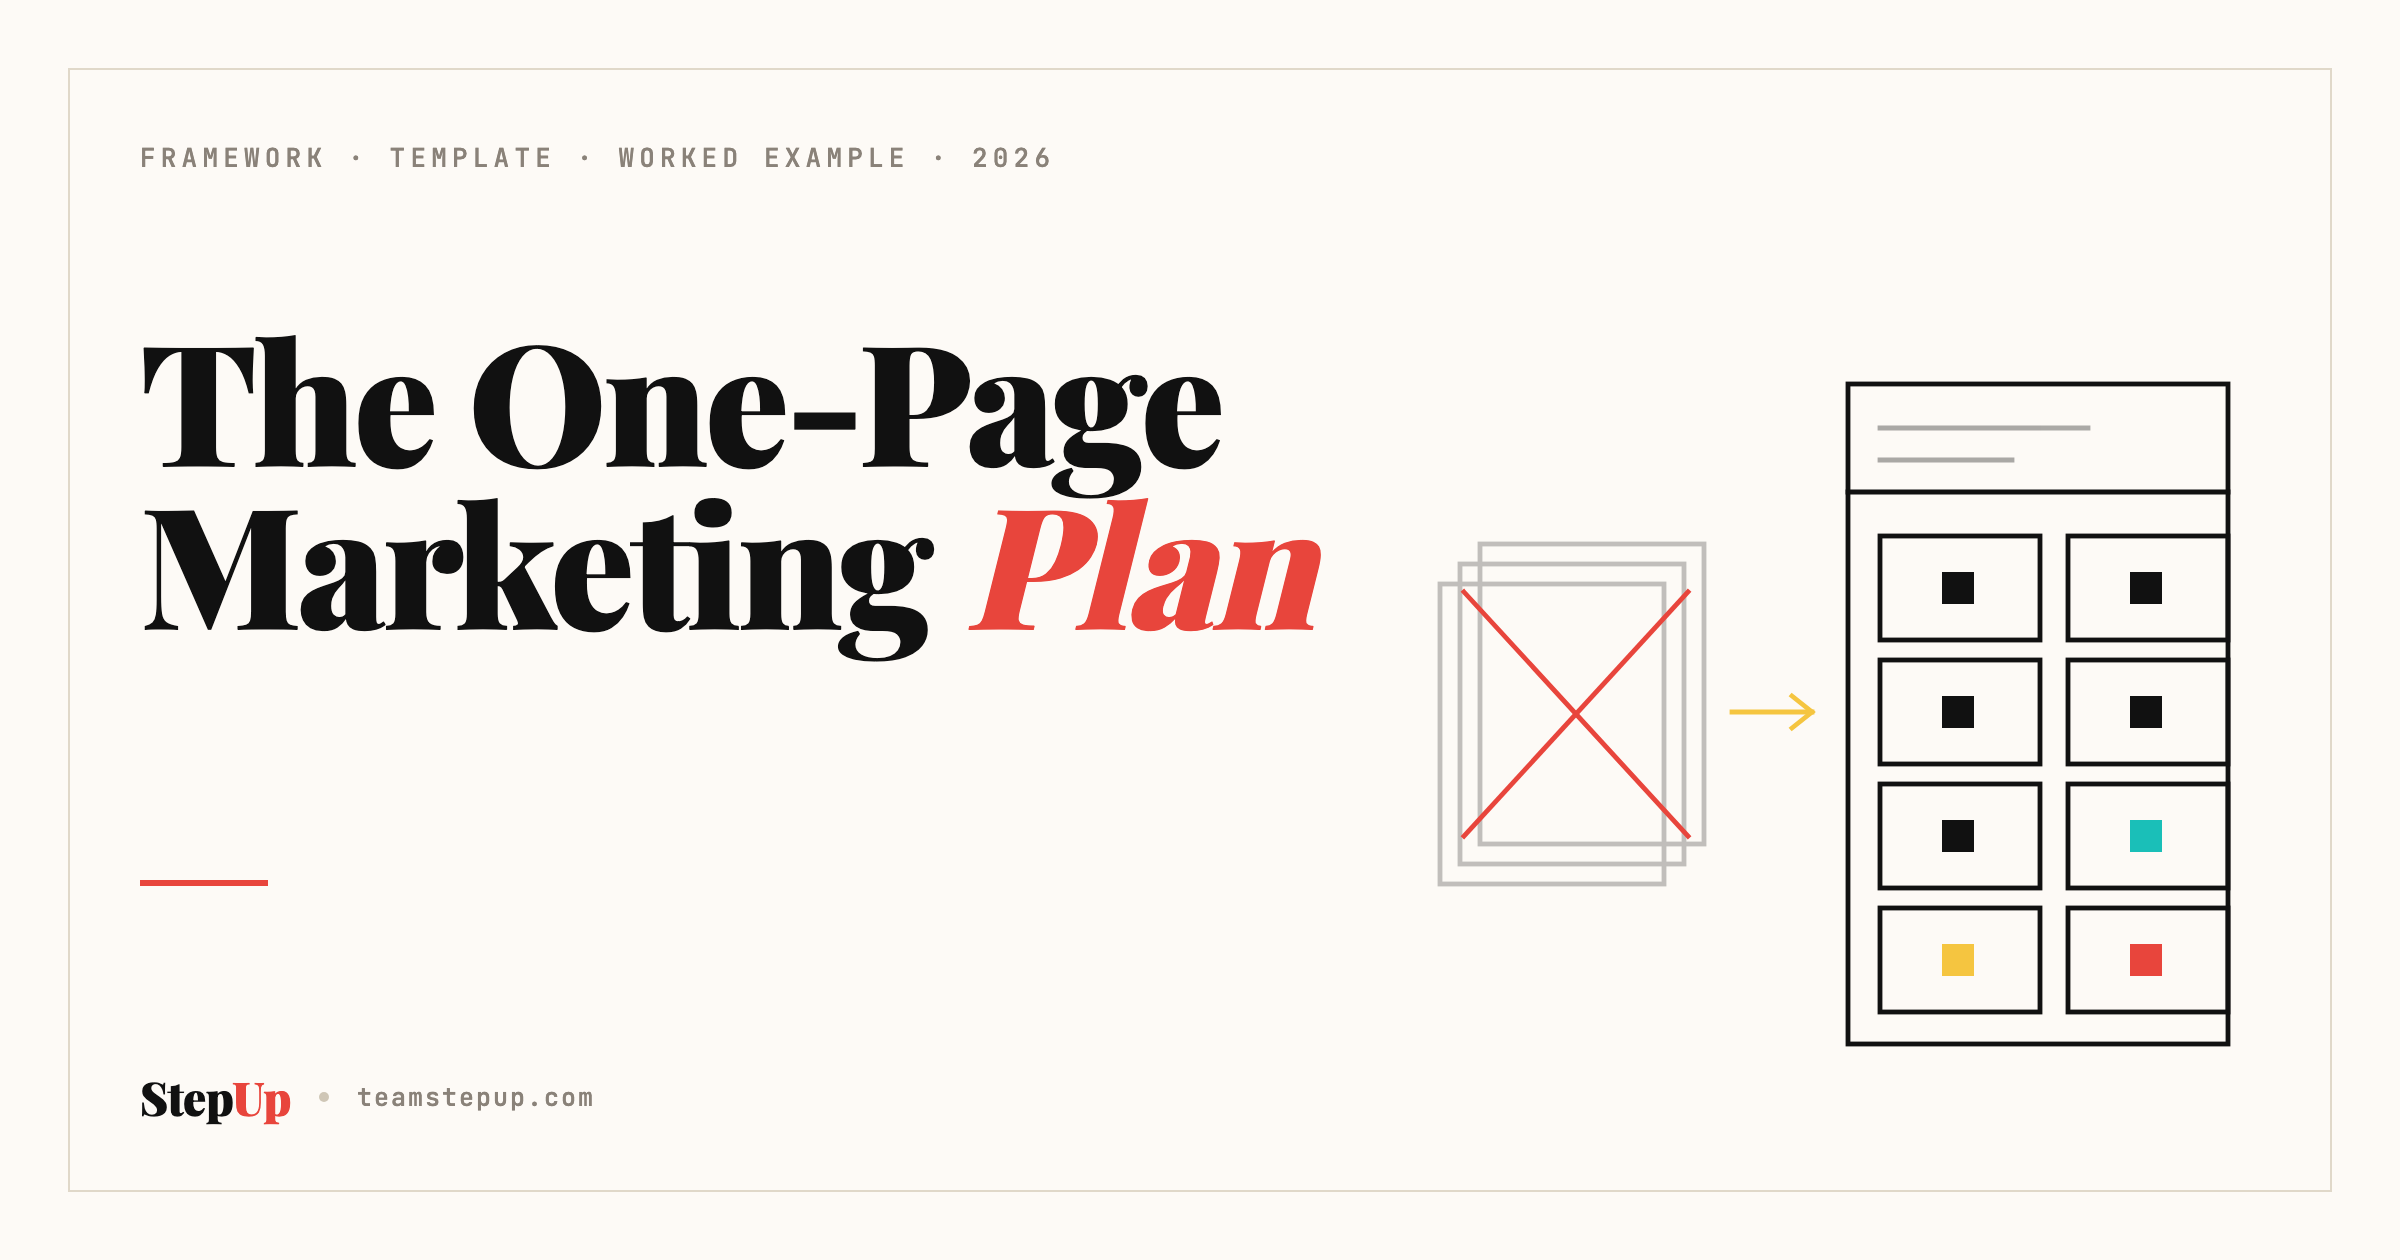
A one-page marketing plan, by contrast, is built for Tuesday morning. It forces every real decision — who you’re selling to, why they choose you, what you’re doing about it, and how you’ll know it worked — onto a single page you can pin above a desk, open in a weekly meeting, or hand to a new hire on their first day. If it doesn’t fit on one page, it isn’t a plan. It’s a wish list with formatting.
This guide gives you the framework, a fill-in template you can copy into a doc in the next five minutes, and a fully worked example for a B2B software company. Not a bakery, not a food truck, not the coffee shop every other guide recycles. It also covers the part almost nobody writes about: how to keep the page accurate after week four, when reality has moved and the plan on the wall hasn’t.
A one-page marketing plan is a single-page document holding your entire marketing approach: target audience, positioning, goals, channels, budget, metrics, timeline, and owners.
It is not a summary of a longer plan. It is the plan. Anything that can’t earn a line on the page gets cut, and the cutting is the useful part. If a decision can’t survive being written in one sentence, it usually isn’t a decision yet. It’s a placeholder for one nobody has made.
The format comes from Allan Dib’s book of almost the same name, which popularised a nine-square grid for small businesses: Before, During, and After the sale. It’s a sound mental model for solo operators and local businesses, and his own site is still the best place to see the original nine-square grid. It was never built for companies with six-month sales cycles, four people on the buying committee, and a marketing team that has to coordinate content, paid, product marketing, and sales support against a single number.
That’s the gap this guide fills. The discipline of the original, rebuilt for how B2B revenue actually works.
Long strategy decks fail for a structural reason, not a quality one. Admittedly, they’re built to win the budget conversation, and they’re very good at that. Then the budget is approved, the deck is filed, and the team goes back to running whatever it was already running. The deck never told anyone what to do on Monday.
A one-page marketing plan is optimised for the opposite moment: the ordinary week. It has three properties a deck doesn’t.
It’s legible in under two minutes. Anyone on the team, including a new salesperson in their first week, can look at it and know the target account, the message, and this quarter’s number without a briefing.
It forces a priority order. A deck can hold five strategic pillars and twelve key initiatives without anyone noticing there’s no order to them. Meanwhile, a page has room for three or four channels done properly. That constraint is the whole point.
It’s cheap to update. Because it’s short, revising it isn’t a project. You can change it in a Monday meeting, which matters, because target accounts and channel performance move faster than an annual planning cycle admits.
The one-page marketing plan isn’t a stylistic preference. It’s an execution discipline. The companies that actually hit their numbers treat the plan as an operating document the whole team references weekly, not a strategy artifact revisited once a year.
The page is short, which fools people into thinking it’s quick. It isn’t. The page is the output of four decisions, and if any of them are still open, you’ll feel it immediately: the section reads vague, and no amount of rewriting fixes it, because the vagueness is in the thinking, not the sentence.
Who you actually sell to. Not the market category. The specific profile of a company that buys, uses, and renews. If that work isn’t done, start with what an ICP is and how to build one, then come back.
How big that group really is. A plan aimed at a segment too small to carry the number is a plan that fails on arithmetic, not execution. Sizing the addressable market is a one-afternoon exercise that saves a quarter.
What the alternatives look like to your buyer. Your positioning is a claim about a choice they’re making between you and someone else, and you can’t write it without knowing what the someone else says. A structured look at the competitive set gives you the language to write against.
What’s already working and what isn’t. Most teams have more evidence than they use. A short audit of current marketing tells you which channels have earned another quarter of budget and which have been coasting on habit.
Have those four, and the page takes an hour. Skip them, and you’ll produce a page that looks like a plan and behaves like a poster.
Every one-page marketing plan that works answers eight questions, in this order, because each one depends on the answer before it.
Skip one and the plan collapses somewhere further down. Teams that skip the first end up with messaging that could belong to any vendor in the category. Teams that skip the sixth don’t discover the plan failed until the quarterly review, when the money is already spent. The order matters as much as the content.
Here’s what belongs in each section, and what to leave out.
This is the section most plans get wrong, and everything downstream depends on it. Certainly “mid-market software companies” is not an audience. It’s a category containing thousands of businesses, most of which will never buy from you.
The page needs a definition tight enough that anyone on the team can look at a company and answer yes or no in five seconds. That means four lines:
That last line is the one almost everyone skips, and it’s usually the most valuable sentence on the page. Knowing who you don’t sell to is what stops the content team producing material that technically applies to everyone and moves no one.
Three or four lines, no more. If describing your target account takes a paragraph, the work isn’t finished. You’ve moved the vagueness from the category into the description. When you’re ready to tighten it properly, the practical build guide for an ideal customer profile walks through the evidence to use.
Your value proposition is the one sentence explaining why a buyer picks you over the next three names on their shortlist. Not a mission statement, nor a feature list, and certainly not “we help companies grow.”
Here’s the test. Read your sentence out loud, then read your closest competitor’s homepage headline out loud. If they’re interchangeable, you don’t have a value proposition. You have category language. Notably, a buyer running an evaluation reads five or six near-identical claims in a morning. The page should force you to write the one that isn’t.
A structure that holds up:
For [specific audience], [company] is the only [category] that [specific mechanism], so [specific outcome], without [the tradeoff the alternatives force].
The last clause is the one most companies leave off, and it’s usually the most persuasive part. Buyers want to know what they get. They’re at least as interested in what they don’t have to give up.
One number. Not five.
The most common failure in this section is a list of awareness, engagement, qualified leads, revenue, and brand health, all presented as equals. They aren’t equals. In a plan that drives decisions, one of them is the number everything else ladders up to, and the rest are diagnostics you watch.
Generally, for most B2B companies that number is sourced revenue or qualified sales opportunities. Not traffic, not leads. Those are activity measures, useful for working out why the plan is off track and useless as the plan’s objective, because a team can hit a lead target and miss revenue by a mile. If the handoff between marketing and sales is where your numbers keep breaking down, the difference between an MQL and an SQL is worth settling before you write this line.
On the page:
That gap line is what turns a goal into a plan. “$1.2M in new opportunities” is a wish. “$1.2M in new opportunities, current run rate $700K, the missing $500K comes from paid coverage in the two segments where we’re underspending” is a decision you can argue with.
This is where one-page plans go one of two wrong ways: too vague to act on, or too crowded to focus. The fix is the constraint that makes the whole format work. Choose fewer channels than feels comfortable, then say exactly what happens in each one.
Your channels should map to where your buyers actually research, which in B2B is overwhelmingly self-directed. Peer reviews, search, LinkedIn, industry communities, and existing vendor relationships all get used long before anyone talks to a salesperson. The mix should reflect that, not a generic “content, social, email, paid” list inherited from a template.
For each channel, one line with three things:
So a plan with “content marketing” as a line item isn’t a plan. It’s a heading. It tells nobody what to publish next Tuesday. If the distinction between publishing consistently and building a system that compounds is still fuzzy on your team, content marketing versus inbound is a useful hour.
Most guides skip budget entirely or reduce it to “60% content, 40% paid.” That number is meaningless without context. The right split depends on sales cycle length, how much of your audience is already looking, and how much of it you have to reach before it starts looking.
Three lines belong on the page:
That third line is what makes budget a planning tool instead of an accounting record. If ninety per cent of your money is locked up, you have no way to respond when a channel is clearly working or clearly isn’t by week six. Better to know that when you write the plan than to discover it in week ten. For the underlying logic of how much to spend and against what, see how to set a B2B marketing budget.
Section 3 says what winning looks like at the end. This section says how you’ll know you’re on track during.
Two tiers, and the split matters:
Meanwhile, the trap here is filling the section with numbers that feel like progress and predict nothing. Page views, impressions, and total leads can all rise while revenue stays flat, because none of them know whether the traffic matches the audience defined in section 1. Every measure on this page should trace back to that definition. If it doesn’t, it’s noise with a chart attached.
A month-by-month view of when each tactic ships, launches, or reports. Not a Gantt chart. Three or four rows.
| Month | Key activities | Milestone |
|---|---|---|
| Month 1 | Launch the content series, set up paid campaigns | First two assets live |
| Month 2 | Adjust based on early conversion data | Mid-quarter checkpoint |
| Month 3 | Scale what’s working, stop what isn’t | Quarter-end review against the goal |
The timeline isn’t there for project management. You have other tools for that. It’s there to put a checkpoint inside the quarter, so a channel that isn’t working gets caught in week six rather than diagnosed in the review after the money is gone.
One name accountable for the plan. One name per channel line. A tactic with nobody’s name against it doesn’t get done with any urgency, however well it’s written.
Then the cadence: which parts get looked at weekly, when the plan gets revised, and when it gets rebuilt. Write it on the page. A review that lives only in someone’s intention doesn’t happen.
Ask a chatbot to write your one-page marketing plan and you’ll get something that looks right and says nothing. Eight tidy sections, category language throughout, an audience definition that would suit any competitor, and a goal with no number in it. That output is not a tool failure. It’s a mirror. The model had nothing specific to work from, so it returned the average of everything it has read.
Used differently, though, AI is genuinely good at three jobs on this page, and they’re the three jobs people are worst at doing alone.
Pressure-testing the audience definition. Give it your section 1 alongside a list of ten companies, five that bought and five that didn’t, and ask which of them your definition would have predicted correctly. This is the fastest way to find out that your criteria describe your customers after the fact and wouldn’t have picked them in advance. Then feed it your closed-lost reasons and ask what disqualifier the pattern suggests. The disqualifier line is the hardest one to write from memory and the easiest to derive from evidence.
Breaking the value proposition. Paste your sentence in next to the homepage headlines of your four closest competitors, and ask which claims are interchangeable and which are genuinely yours. Then ask the harder question: what would a sceptical buyer need to see to believe the claim. If the answer is proof you don’t have, the sentence isn’t ready, and better to learn that now than in a sales call.
Doing the arithmetic on the gap. Section 3 asks where the missing revenue comes from. That’s a modelling question, and it’s tedious by hand. Give it your current conversion rates by channel, your average deal size, and your cycle length, and have it show what has to be true for each channel to close the gap. Half the time the answer is that the plan requires a conversion rate nobody has ever achieved, which is worth knowing in week one rather than week ten.
What to keep away from it: the narrative. Your positioning, your message, and the way your company sounds are not places to accept an average answer, because average is precisely what makes marketing invisible. Draft those yourself, then use the model to attack them.
The order matters more than the prompt. Bring specifics and it sharpens them. Bring vagueness and it will return the same vagueness, formatted more confidently, and the confidence is the dangerous part.
Here’s the part every other guide to the one-page marketing plan leaves out, and it’s the reason most one-page plans die the same death as the decks they replaced.
A plan that’s static is already going stale.
The traditional model is that someone builds the plan quarterly and updates it manually, if they remember, at the next review. In practice, “update it manually” loses to everything else on a marketer’s week. By week four the page on the wall and the reality in the business have quietly separated, and nobody has noticed because nobody has checked.
The fix isn’t a better template. It’s treating the page as something a system keeps current, rather than something a person retypes. Three things make that real:
Performance data comes to the plan, not the other way round. Revenue by channel, conversion by segment, engagement on named accounts, pulled from the CRM and analytics and summarised against the goals already written on the page. The weekly check in section 6 should take ten minutes, not half a day of exporting spreadsheets.
Drift gets flagged when it happens. If cost per opportunity doubles in week three, or a channel meant to produce forty per cent of new opportunities is producing twelve, that should surface as a note against the plan that week. Not six weeks later inside a slide someone built for a review.
The redraft comes with the alert. The useful version isn’t “channel X is underperforming.” It’s “channel X is underperforming, here’s what moving the flexible spend to channel Y does to the numbers in section 5, here’s the revised page for review.” A person still makes the call. The analysis and the rewrite shouldn’t need a meeting to produce.
This is the difference between AI stuck on top of a marketing plan and AI underneath one. Consequently, the page doesn’t need an artificial intelligence section. It needs the discipline of staying accurate, applied automatically, so the page you wrote in January is still the page your team is running in September rather than a historical document nobody has opened since it was approved.
Worth being blunt about the order of operations, because it’s where most teams get this backwards: none of this works on a plan that was vague to begin with. Automation applied to a clear plan keeps it honest. Automation applied to an unclear one just produces confident-sounding updates about goals nobody agreed on. We’ve written separately about why AI exposes weak marketing rather than fixing it, and the one-page plan is the cleanest illustration of it. The page has nowhere to hide a fuzzy decision.
There’s a use for a one-page marketing plan that has nothing to do with marketing operations, and it’s often the one that matters most.
Marketing underperforms in a lot of companies not because the strategy is wrong but because leadership can’t see what marketing is doing. The work is real, the effort is real, and yet from the CEO’s chair it looks like activity without a shape. That gap is where budgets get cut and where the marketing lead stops being invited to the conversations that decide things.
A one-page marketing plan closes it faster than any dashboard. Three reasons:
It’s short enough to actually get read. A CEO will read one page. They will not read your channel strategy document, and it isn’t a character flaw. They’re making decisions across the whole business, and marketing gets the same few minutes as everything else.
It shows the reasoning, not just the results. The gap line in section 3 and the fixed-versus-flexible split in section 5 tell a leader how you think. That builds far more confidence than a green dashboard, because it shows you know where the plan is fragile.
It makes the plan arguable. This sounds like a drawback and is actually the point. When leadership can see that the number depends on two specific segments and a specific budget split, they can push back on the substance instead of vaguely wanting more. An argument about the plan is a much better meeting than an argument about whether marketing is working.
There’s a defensive benefit too. When a leader asks mid-quarter for a campaign that isn’t on the page, you’re not arguing about priorities in the abstract. You have a document showing what the quarter’s money and time are committed to, and the conversation becomes what to trade rather than what to add. Sometimes the answer is genuinely to add it. But the trade gets made deliberately, on the record, rather than absorbed silently by a team that then misses the number.
Companies running this well use the page as the standing first slide of the monthly leadership update. Same page every month, updated numbers, visible drift. After two or three months, leadership starts reading marketing as a system with inputs and outputs rather than a department that produces things. That shift is worth more than any single campaign on the page.
Generic examples are why most one-page marketing plan guides don’t actually help. A bakery’s plan doesn’t translate to a company selling a $32K annual software contract to a VP of Operations who has to get an IT director’s approval.
So here’s a complete plan for an illustrative composite company. The numbers are realistic for its size and market, and they’re meant to be argued with, which is the point of showing them.
Meridian Flow. Workflow automation for manufacturing operations teams. $8M in annual recurring revenue, 45 employees, average contract $32K a year, four to six month sales cycle.
VPs and Directors of Operations, and Plant Managers, at mid-market discrete manufacturers of 150 to 1,500 employees, currently running production scheduling in spreadsheets or a legacy system with no live visibility. Trigger: a recent scheduling failure or missed customer deadline that made leadership question the current tooling. Committee: Ops VP (champion), Plant Manager (user), IT Director (technical veto), CFO (approves above $25K). Disqualifier: companies already running a modern ERP with a scheduling module. Meridian Flow doesn’t replace those. In particular, it fills the visibility gap for companies without one.
For mid-market manufacturers running production on spreadsheets, Meridian Flow is the only scheduling platform that gets live floor visibility running in under two weeks with no IT project, so plant managers stop firefighting missed deadlines, without the six-month implementation their IT director keeps blocking.
Primary: $2.1M in new sourced opportunities by the end of Q4. Current run rate: $1.3M. Gap: $800K, targeted at the two verticals where the win rate is highest and the spend is lowest, automotive suppliers and industrial equipment. Supporting: 25% conversion from qualified marketing lead to qualified sales opportunity, 15% engagement rate across the named account list.
| Channel | Tactic | Owner | Cadence |
|---|---|---|---|
| Organic search | Two bottom-of-funnel comparison and cost-of-delay pieces aimed at scheduling-software evaluation searches | Content lead | Monthly |
| LinkedIn, named accounts | Campaigns against the named list in automotive and industrial equipment, savings calculator as the offer | Demand gen | Ongoing, reviewed fortnightly |
| Partner co-marketing | Joint webinar with a non-competing adjacent vendor, shared attendee list | Marketing and partnerships | Once per quarter |
| Sales-triggered | Case study sends to engaged named accounts, personalised by vertical | Sales and marketing | Weekly |
$95K for the quarter. LinkedIn named accounts 35% ($33K), content production 25% ($24K), partner activity 20% ($19K), reallocation reserve 20% ($19K). Committed: $41K in tools and the retained content team. Movable: $54K.
Leading, weekly: named-account engagement rate, qualified leads by vertical, calculator completion rate. Lagging, quarter end: sourced opportunities against $2.1M, win rate by source.
Month 1: launch campaigns in both verticals, publish the first comparison guide. Month 2: mid-quarter checkpoint, move the reserve based on early vertical performance. Month 3: partner webinar, scale the winning channel, publish the second asset, quarter-end review.
Owner: VP Marketing. Channel owners as listed above. Subsequently, leading indicators get reviewed every Monday in the opportunity meeting. Full revision at the mid-quarter checkpoint and again at quarter end. CRM data summarised against this page every Friday. Any channel more than 20% off target goes onto Monday’s agenda rather than waiting for the checkpoint.
Notice what makes this usable in a way a filled-in template usually isn’t. Every number ties to a real constraint. The disqualifier is as specific as the target. And the timeline has a decision built into it, not just a list of activities.
Drop this into a doc, a Notion page, or a slide, and fill in the brackets. Keep to the line limits. The constraint is what makes it a one-page plan instead of a one-page summary of a longer plan you haven’t written.
COMPANY: [Name] | PERIOD: [Quarter/Year] | OWNER: [Name]

1. TARGET AUDIENCE (3-4 lines)
Firmographics: [employee range / revenue band / vertical]
Buying committee: [champion / user / technical veto / budget approval]
Trigger: [what has to be true for this to be urgent]
Disqualifier: [who looks like a fit but isn't, and why]

2. UNIQUE VALUE PROPOSITION (one sentence)
For [specific audience], [company] is the only [category] that
[mechanism], so [outcome], without [the tradeoff the alternatives force].

3. GOALS
Primary goal: [one number, one timeframe]
Current run rate: [number]
Gap: [delta, and where it comes from]
Supporting measures: [2-3 maximum]

4. CHANNELS AND TACTICS
| Channel | Specific tactic (not a category) | Owner | Cadence |
[3-4 rows maximum]

5. BUDGET
Total: [amount for the period]
Split by channel: [% or amount per channel above]
Committed vs movable: [locked / reallocatable mid-quarter]

6. METRICS
Leading, checked weekly: [2-3 indicators]
Lagging, checked at period end: [the primary goal]

7. TIMELINE
Month 1: [activities] -> Milestone: [checkpoint]
Month 2: [activities] -> Milestone: [checkpoint]
Month 3: [activities] -> Milestone: [checkpoint]

8. OWNERSHIP AND REVIEW
Plan owner: [name]
Channel owners: [name per channel row]
Review: [weekly check / mid-quarter revision / quarter-end rebuild]
Fill it in, then resist the urge to add a ninth section. If something doesn’t fit into these eight, it belongs in a supporting document. Namely a positioning brief, a channel playbook, a campaign outline. Not on the plan.
Five goals instead of one. The moment a plan has several co-equal primary goals, it stops working as a decision tool, because when two of them compete for the same budget, nobody knows which wins.
An audience definition broad enough to cover half the market. If your definition would also describe three competitors’ customer bases, it hasn’t constrained anything. The disqualifier line is what separates a real audience from an aspiration about market size.
Channels chosen because they’re normal. “We should be doing content, social, email, and paid” isn’t a channel strategy. It’s a list copied from every other company in your category, including the ones it isn’t working for.
Treating the page as a quarterly artifact. This is the single biggest reason one-page marketing plans fail at the same rate as the decks. A plan nobody has compared against actual performance since the kickoff isn’t a plan. It’s a memory of one.
No owner per channel. Ultimately, a line item with no name attached gets done last, every time.
Metrics that don’t trace back to the audience. Traffic and leads that don’t match section 1 will make the plan look healthy right up until the revenue doesn’t arrive.
A one-page marketing plan is not a document. It’s a habit that happens to have a document attached.
The teams this works for are the ones who put it on the wall, open it every Monday, argue about it in front of their CEO, and rewrite it when the evidence changes. The teams it doesn’t work for are the ones who build a beautiful page in January and treat the building as the achievement.
Admittedly, the format won’t do the second part for you. But it makes the first part cheap enough that there’s no good excuse left.
A strategy document, firstly, explores options, research, and reasoning. It’s meant to be read once and referenced occasionally. The one-page plan is the output of that thinking, cut down to the decisions that get executed and tracked. Do the strategic work first if you need to. The page is what the team runs on afterwards.
Check the leading indicators weekly, revise the page at a mid-quarter checkpoint, and rebuild it quarterly. Annual-only revision is too slow. After all, channel performance in B2B can change meaningfully inside a single quarter.
Build one page per product or segment if they genuinely have different audiences, positioning, or channels. Don’t force several audiences onto one page. That’s exactly the vagueness the format exists to remove. If the segments share an audience and differ only by product, one page with a note in the channels section is enough.
The audience and channel sections. Consumer plans, including the original nine-square framework, assume one decision-maker and a short consideration period. A B2B plan has to account for a buying committee, a long cycle, and channels that match how business buyers research on their own before contacting anyone. Both the audience definition and the channel mix change substantially as a result.
No. A doc, a slide, or a whiteboard works. The format matters more than the tool. Software earns its place in keeping the page current, pulling performance against the goals automatically instead of leaving someone to retype a document that’s already out of date.
One person, named on the page. In smaller companies that’s usually the most senior marketer or the founder running marketing. In larger ones it’s the VP or head of marketing. Shared ownership sounds collaborative and reliably means the page belongs to nobody. Similarly, channel owners are different, and there should be one per line.
Then the page is doing its job by making the change visible. Put the new goal on it, restate the gap, and show what has to come off the channel list to fund it. The problem isn’t leadership changing direction. It’s direction changing without anyone recalculating what it costs, which is how teams end up with three quarters of half-finished work and no explanation for the number.
It gets built, presented, and never checked against reality again. That is the same failure as the long deck it replaced, and the format alone doesn’t fix it. The weekly check against section 6 is what turns the page into an execution tool instead of a better-looking artifact.
Want to know where your marketing stands against the market? The AI-Readiness Audit is a short call that looks at your marketing and pinpoints exactly where the gap is — and what it is worth to close first. You leave with a clear picture, even if we never work together.