B2B Marketing KPIs: The Few That Matter to Your CEO
Originally published December 2023. Updated October 2026.
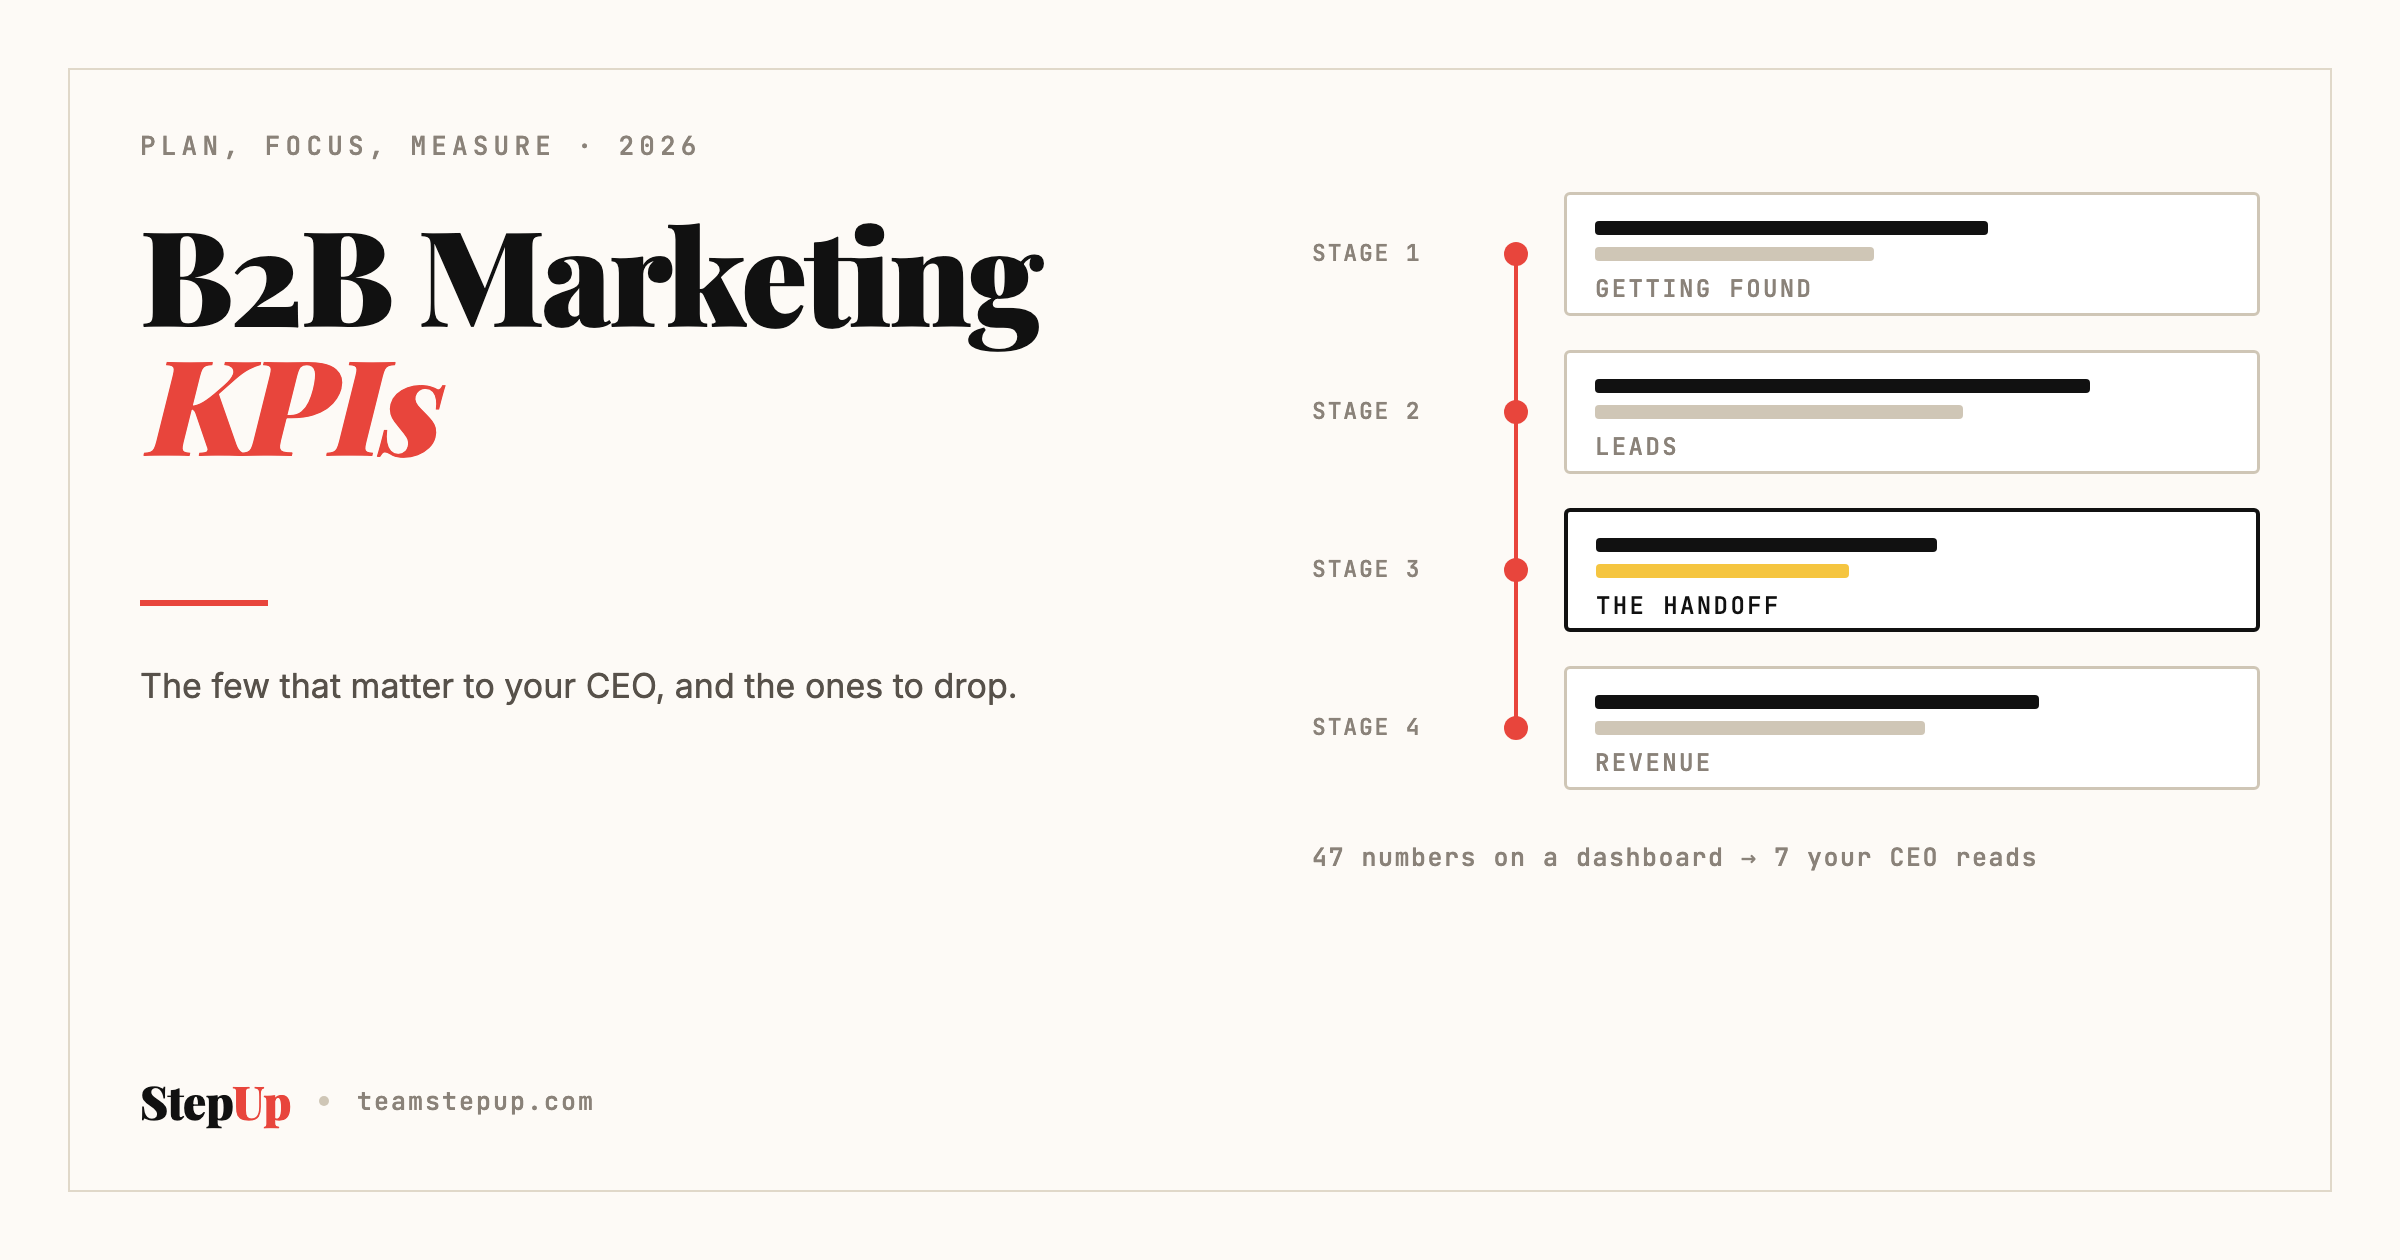
Somewhere in your company there is a marketing dashboard with 47 numbers on it. It has charts. It has colors. There’s even a little arrow next to “impressions” that has been pointing up since 2022.
Nobody has opened it since the person who built it left.
That’s the trouble with marketing KPIs. They’re easy to collect and hard to care about. The tools will happily track everything, so teams track everything, and the one number the CEO actually wanted (are we getting more of the right customers?) is buried under bounce rates and follower counts.
It doesn’t help that every AI tool now promises an “AI-powered insights layer” that reads all 47 numbers for you and writes a summary. (The summary, in my experience, says engagement is up and you should keep doing what you’re doing. Thanks.)
Truth is, the fix isn’t more numbers or a smarter summary. It’s fewer numbers, chosen on purpose, that connect marketing to revenue. The right B2B marketing KPIs fit on one page, and your CEO can read them in two minutes.
This guide covers what KPIs are in marketing, the twelve worth tracking at each stage of the funnel, which ones to drop, and how to report them.
What Are KPIs in Marketing?
A KPI, or key performance indicator, is a number that tells you whether marketing is doing its job. The word that matters is “key.” A metric is anything you can measure. A KPI, by contrast, is one of the few metrics you’ve decided to manage the business by.
So “website visits” is a metric. “Website visits from our target region, per month” can be a KPI, if more of them is part of the plan.
For a B2B company, good marketing KPIs share three traits:
- They connect to revenue. In other words, each one sits somewhere on the path from stranger to customer.
- Someone owns them. One person answers for each number.
- They lead to a decision. If the number moves, you know what to do differently.
So if a number fails all three, it’s a vanity metric. It can stay in the tool, but it doesn’t need to be in the report.
Why B2B Marketing KPIs Are Different
B2B buying is slow, involves several people and often happens out of sight. A buyer reads three of your blogs, forwards one to her CFO, and fills in a form two months later. As a result, the KPIs that work for a consumer brand (daily sales, cart size) don’t translate.
Instead, B2B teams need KPIs that track the whole path, including the handoff to sales. They also need patience. For instance, a KPI that only measures this month’s leads will push the team toward whatever produces leads fastest, which is rarely the work that produces customers.
The 12 B2B Marketing KPIs Worth Tracking
These are the marketing KPIs we use with B2B clients, grouped by stage. Still, most teams need two or three per stage, not all twelve.
Getting Found
| KPI | What It Tells You | Where It Comes From |
|---|---|---|
| Clicks from Google | Whether people who see you in search choose you | Search Console |
| Searches where you show on page one | How much of your market can find you | Search Console |
| Visits from your target region | Whether you reach your market or someone else’s | Analytics |
Turning Interest Into Leads
| KPI | What It Tells You | Where It Comes From |
|---|---|---|
| New leads from your target customer profile | Whether the right people raise their hand | CRM |
| Visit-to-lead rate on key pages | Whether your pages make the case | Analytics and CRM |
| Cost per qualified lead | What a good lead costs you, by channel | Ad accounts and CRM |
Handing Leads to Sales
| KPI | What It Tells You | Where It Comes From |
|---|---|---|
| Marketing-qualified to sales-qualified rate | Whether sales agrees the leads are good | CRM |
| Speed to first follow-up | Whether good leads go cold waiting | CRM |
| Sales calls booked from marketing leads | Whether marketing creates real conversations | CRM and calendar |
Revenue
| KPI | What It Tells You | Where It Comes From |
|---|---|---|
| Pipeline created from marketing leads | The dollar value marketing starts | CRM |
| Customers won from marketing leads | The part of revenue marketing can claim | CRM |
| Customer acquisition cost | What a new customer costs, all in | Finance and CRM |
The handoff stage is the one most teams skip, and it’s often where the biggest losses are. If marketing and sales don’t agree on what a qualified lead is, every KPI after it is an argument. Our guide to MQL vs. SQL explains how to settle it.
KPIs to Drop From the CEO Report
Some numbers are useful to the person running a channel and useless to the CEO. So keep them in the channel report and out of the leadership one.
- Impressions and reach. They measure how loudly you spoke, not who listened.
- Follower counts on their own. Useful as a trend, meaningless as a goal.
- Email open rates. Privacy changes made them unreliable. Clicks and replies say more.
- Total leads with no quality filter. A thousand leads from the wrong market is a cost, not a win.
- Time on page. Interesting for content editors, not for revenue.
In short, the test is simple: if the CEO saw this number double, would she know what to do? If not, it’s not her KPI.
How Many KPIs Should a B2B Marketing Team Track?
For the leadership report, five to seven. One or two per funnel stage, plus pipeline. Each channel owner can track more for their own work, but the shared page stays short.
Also, if you’re setting goals for the quarter at the same time, the KPIs become the starting numbers for your key results. Our guide to marketing OKRs shows how the two fit together.
How to Report Marketing KPIs So Leadership Reads Them
A KPI report is a decision document, not a data dump. A format that works:
- One line on the quarter’s goal and whether you’re on track.
- Five to seven KPIs, each with last period, this period and target.
- One line under each number on what it means.
- What you’re changing, and what you need from leadership.
Keep it to one page. Moreover, send it on the same day every week or month, so people learn to expect it.
Where AI Fits in KPI Tracking
AI is good at the slow, repetitive part of KPI work. For example, it can pull numbers from Search Console, the CRM and the ad accounts, check them against their source, and draft the summary. In fact, AI already does this for our own team each week, and it catches mismatches a tired person would miss.
What AI can’t do is decide which KPIs matter, or what to do when one drops. That’s because those calls depend on the plan, the market and what sales is hearing. So let AI do the counting, and keep the choosing with a person.
Frequently Asked Questions
What are KPIs in marketing?
KPIs in marketing are the few numbers a team uses to judge whether marketing is working, such as qualified leads, sales calls booked and pipeline created. Unlike general metrics, each KPI connects to a business goal, has an owner and leads to a decision when it moves.
What are the most important B2B marketing KPIs?
The most important B2B marketing KPIs cover the full path to revenue: clicks from search, qualified leads from your target customer profile, the rate at which sales accepts those leads, sales calls booked, and pipeline created from marketing leads.
How many marketing KPIs should you track?
Five to seven for the leadership report, with one or two per funnel stage plus pipeline. Channel owners can track more for their own work, but the shared report should stay on one page.
What is the difference between a KPI and a metric?
A metric is anything you can measure. A KPI is one of the few metrics you’ve chosen to manage the business by, because it connects to a goal and tells you what to do when it changes.
How often should marketing KPIs be reported?
Weekly for the team running the work, and monthly for leadership. Quarterly, compare the KPIs against the goals you set and use them as the starting numbers for next quarter’s plan.
The Dashboard, Retired
The 47-number dashboard can stay where it is. Somebody might need the bounce rate one day.
Your CEO gets one page: seven numbers, one line under each, and what you’re changing. She’ll read it in two minutes, which is about 46 numbers more attention than the dashboard ever got.
That little arrow next to impressions will keep pointing up. Let it.
Want to see whether your team can track the right numbers with AI doing the counting? The free AI-Readiness Self-Audit shows where you stand.
Want to know where your marketing stands against the market? The AI-Readiness Audit is a short call that looks at your marketing and pinpoints exactly where the gap is — and what it is worth to close first. You leave with a clear picture, even if we never work together.