This guide to total addressable market was originally published May 2023. Updated September 2026.
Total Addressable Market (TAM) is the maximum possible revenue a product or service could generate if it captured 100% of its market, with no competition and no resource constraints. It’s a ceiling, not a forecast. GTM and finance teams use TAM to size opportunity; investors use it to judge upside before funding a company.
What Is Total Addressable Market (TAM)?
TAM tells you the size of the opportunity before you decide whether it’s worth chasing. It’s the revenue ceiling for a specific product in a specific market, not what you’ll capture, but what exists to capture.
Businesses use TAM to set growth targets grounded in an actual market size, not wishful thinking. It also feeds decisions on where to invest: whether a new market is worth entering, whether a product line is worth building, and how much a business is realistically worth to an acquirer or investor.
A B2B software company estimating TAM for a new product typically looks at three inputs: how many companies fit the target profile, what those companies currently spend on comparable tools, and how fast that spending is growing. Multiply those together and you get a number, but that number is only useful if the inputs are real, not generic industry averages. More on that in the mistakes section below.
TAM vs. SAM vs. SOM: What’s the Difference?
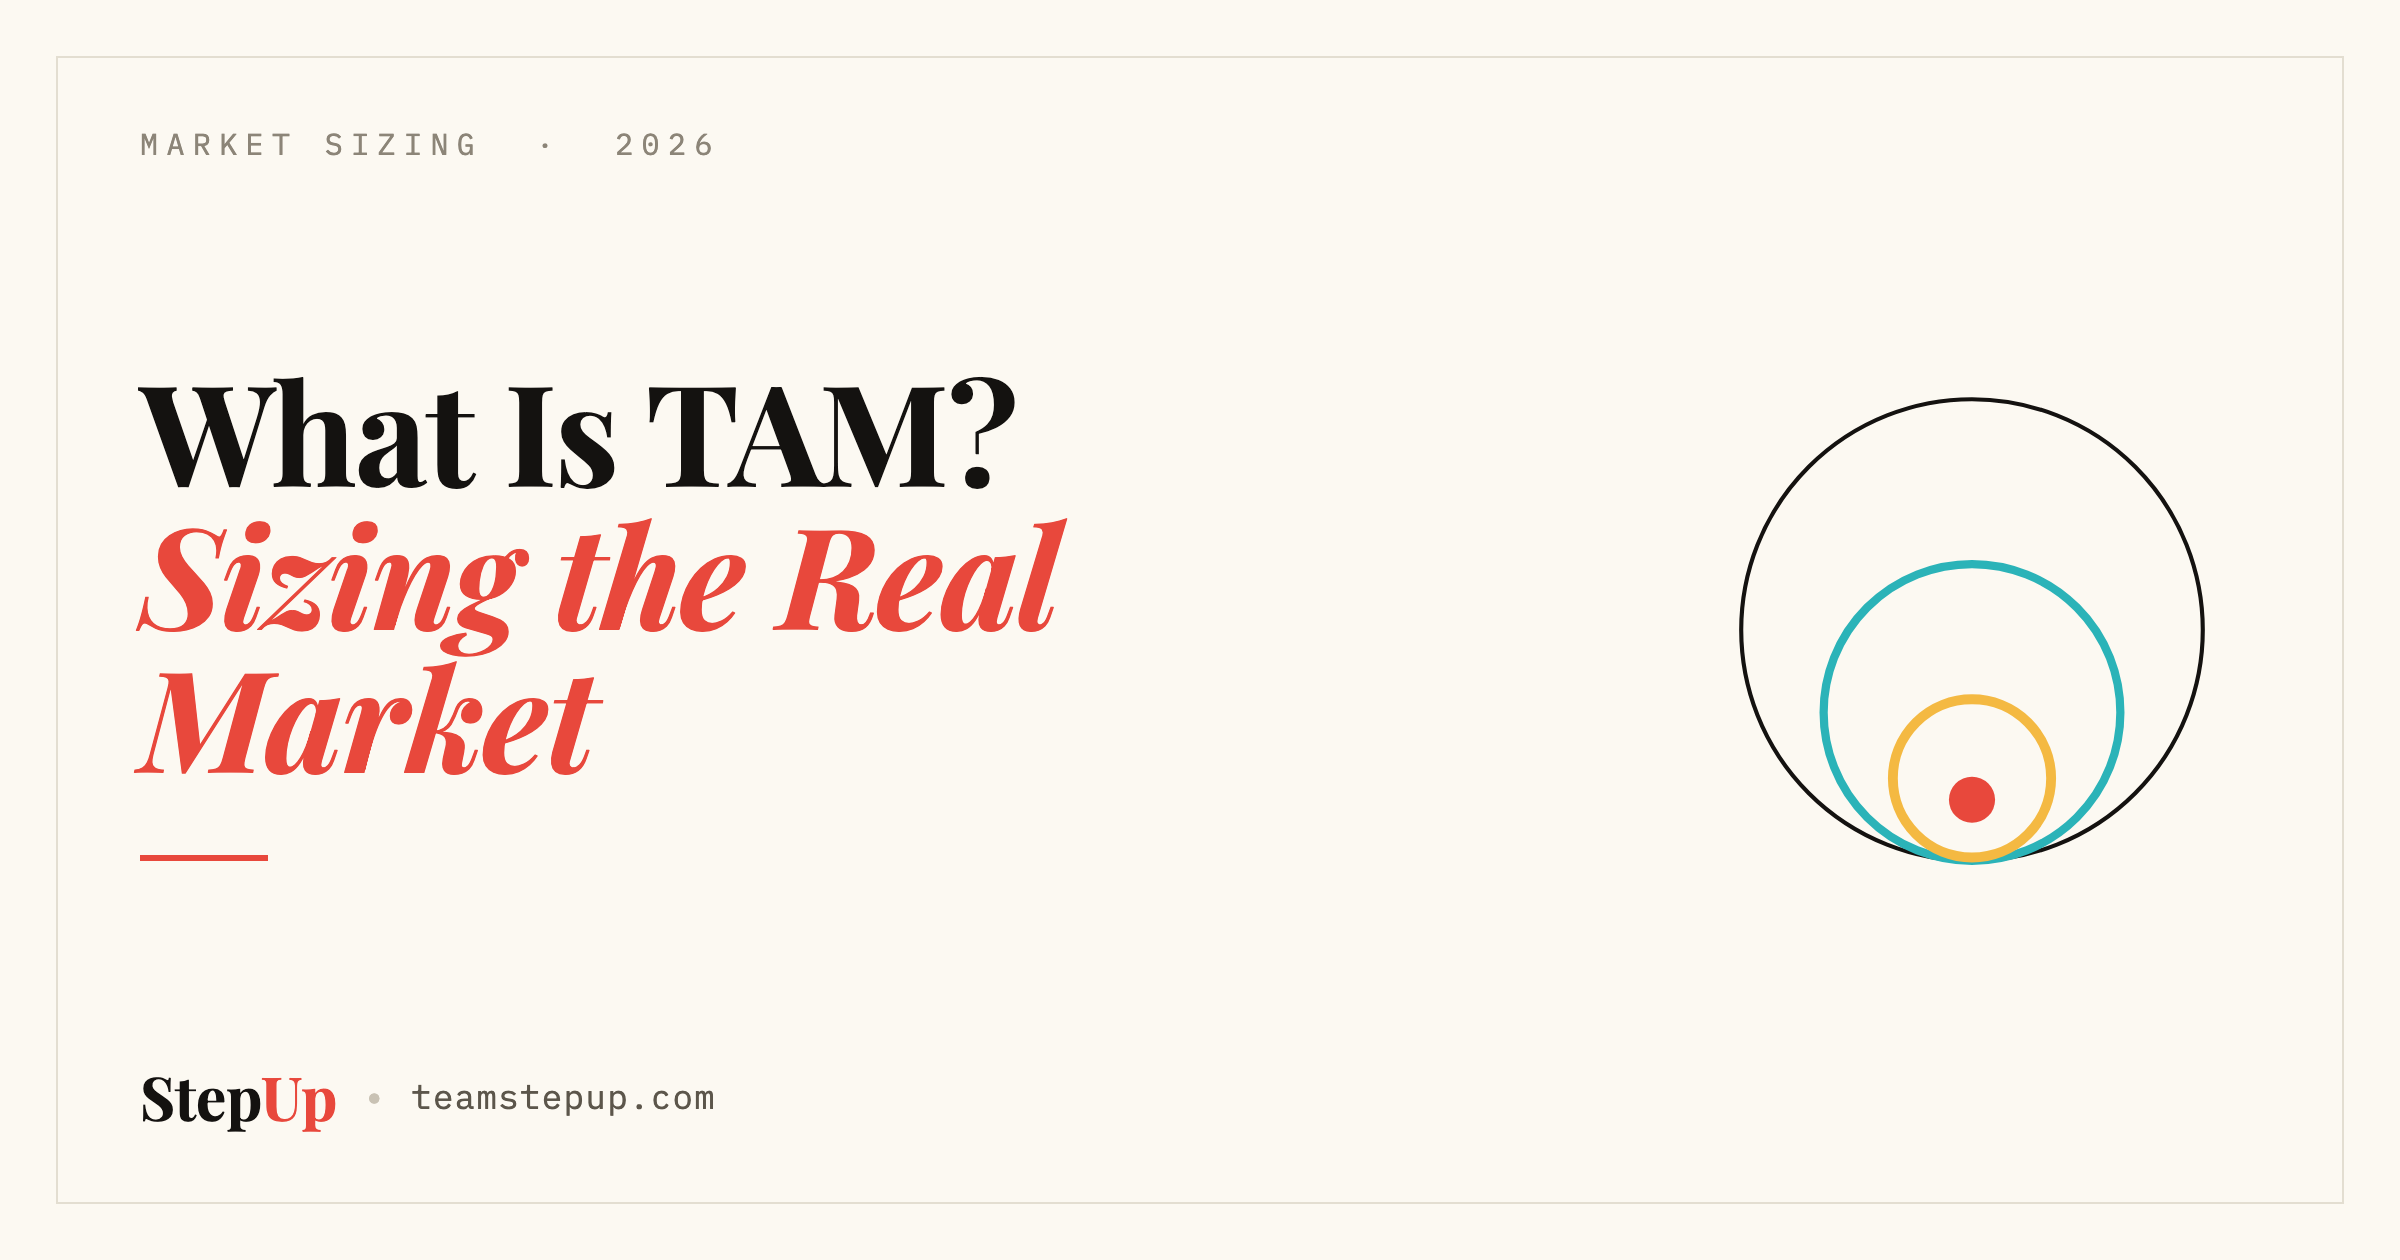
TAM is often confused with two related metrics: Serviceable Addressable Market (SAM) and Serviceable Obtainable Market (SOM). Each one narrows the picture further.
| Metric | What it measures | Example |
|---|---|---|
| TAM | Total revenue opportunity if you captured the entire market | $1B for luxury cars, globally |
| SAM | The portion of TAM you can realistically target given your business model and reach | $100M: luxury cars sold to high-income buyers in your target regions |
| SOM | The portion of SAM you can realistically win, given current resources and competition | $50M: accounting for a specific geography and sales capacity |
The gap between TAM and SOM is where most of the useful strategic thinking happens. TAM tells you the market exists. SOM tells you what’s actually reachable with the team and budget you have.
Why Does TAM Matter for GTM Planning?
Estimating TAM does three things for a business:
- Sets a ceiling for growth targets. You can’t set a credible revenue target without knowing the size of the market underneath it.
- Surfaces new markets and gaps. A company selling organic food in the US might find a $50B domestic TAM, and a separate $20B TAM in a market it hasn’t entered yet. That’s a build case for expansion, not just a nice number.
- De-risks investment decisions. A weak TAM is one of the fastest ways to kill a product idea before it consumes a year of resources. A strong TAM doesn’t guarantee success, but it clears the first bar.
Of course, none of this works if the TAM number is inflated or generic. A TAM built on top-level industry reports, with no filter for your actual ICP, tells you about the industry, not about your business.
How to Calculate TAM: 3 Proven Methods
The basic formula is simple: number of potential customers × average contract value. What changes everything is which number you plug in for each, which is why there are three different methods, and why picking the wrong one produces a number you can’t defend.
#### Top-Down Approach
Start with total market size, from an analyst report or industry database, and narrow it to your segment. Fast to build, but it leans on outside data instead of your own customer or pipeline insight. It’s useful for a pitch deck slide or a first-pass sanity check. It’s a poor basis for planning headcount or quota, because the inputs aren’t filtered for your ICP.
#### Bottom-Up Approach
Start with your actual customer data (segment size, average contract value, real conversion rates) and build up to a total. Slower to produce, but far more defensible, because every input is something you can point to and defend. This is the number that should drive resourcing decisions.
#### Value Theory Approach
Estimate what customers are willing to pay for the specific value you deliver, then multiply by the number of customers who’d pay it. Useful for early-stage companies without market comps or their own sales data yet, because it forces you to define the value proposition precisely before you can put a number on it.
That is why most businesses use a blend: top-down for the pitch deck, bottom-up for the operating plan. Treating the two as interchangeable is where TAM estimates go wrong. See the worked example below.
How to Estimate Your TAM in 5 Steps
Follow these five steps to build a TAM estimate you can actually defend to a board, an investor, or your own leadership team.
- Define your target market. Identify who actually buys: company size, industry, buying triggers, not just demographics. For B2B, this means your ICP: firmographics, tech stack, and the specific trigger that makes a company ready to buy.
- Break the market into segments. Group your target market into segments with shared characteristics and behavior. A fitness app might segment by “committed athletes,” “casual users,” and “rehab/medical use,” each with a different willingness to pay.
- Gather real data. Pull from market reports and analyst data, but weight your own CRM, pipeline, and win-rate data more heavily. Primary data, from surveys, discovery calls, or your own funnel, beats a generic industry report every time.
- Pick your calculation method. Match the method to your data maturity: top-down if you’re early and building a first estimate, bottom-up once you have real segment and deal data, value theory if you’re still validating the offer.
- Validate and revisit. Compare your number against a second method as a sanity check. Then revisit it: TAM shifts as your ICP sharpens, as competitors enter, and as the market itself moves.
A Worked TAM Example: Sizing a $50M ARR Opportunity
Say you’re selling a compliance tool to mid-market fintechs in the US.
Top-down: There are roughly 9,000 mid-market fintechs in the US. Industry data says the average compliance software spend is $18,000 a year. That’s a TAM of $162M.
Bottom-up: You’ve identified 1,200 companies that match your actual ICP, based on revenue band, existing tech stack, and a specific regulatory trigger. At your real average contract value of $22,000, that’s a TAM of $26.4M. A very different number from the top-down estimate, and a much more useful one.
Which number do you plan around? The bottom-up number, almost always. Admittedly, the top-down figure is useful for a pitch deck slide. However, the bottom-up figure is what should actually drive headcount, quota, and channel decisions. The gap between the two isn’t an error: it’s the difference between the size of the market and the size of the market you can actually reach.
Common TAM Mistakes to Avoid
A few mistakes show up in almost every TAM estimate that falls apart under scrutiny:
- Treating TAM as SAM. Quoting the whole-market number when only a fraction of it fits your ICP, product, or geography. Investors and boards catch this immediately.
- Never filtering for ICP. Using an industry report’s total spend figure without subtracting for company size, geography, or buying readiness. That’s the top-down trap in the worked example above.
- Setting it once and shelving it. TAM calculated at the seed round and never revisited, even after the ICP shifted twice since then.
- Skipping the bottom-up check. Presenting only a top-down number because it’s bigger and easier to build, with no bottom-up figure to sanity-check it against.
- Confusing TAM growth with SOM growth. A growing overall market doesn’t mean your obtainable share is growing: competitors and channel saturation can eat that growth before you see any of it.
Frequently Asked Questions About TAM
What’s a good TAM for a B2B startup?
There’s no universal number. What matters is whether your TAM, after you subtract for SAM and SOM, is large enough to support your growth targets. A $50M TAM can be an excellent business if the unit economics work. A $10B TAM means nothing if you can’t realistically capture a viable slice of it.
How often should you recalculate TAM?
At minimum once a year, and any time you enter a new market, add a product line, or your ideal customer profile changes. TAM isn’t a number you set once at the pitch deck stage and leave alone.
What’s the difference between TAM and market share?
TAM is the total opportunity available. Market share is the percentage of that opportunity you’ve actually captured. You can have a large TAM and a tiny market share, and that gap is usually where the growth strategy lives.
Can a TAM be too big to be useful?
Yes. A TAM calculated at the whole-industry level is usually too broad to guide real decisions. The more useful number is almost always your SAM: the portion of that market you can actually serve given your product, pricing, and reach.
Do investors care more about TAM or SAM/SOM?
Both, but for different reasons. TAM tells them the ceiling. SAM and SOM tell them whether you have a credible plan to reach a meaningful piece of that ceiling in a reasonable timeframe. A huge TAM with no credible SOM story is a common reason pitches stall.
What Comes After You’ve Sized Your TAM
Sizing the market answers one question: how big the opportunity is. It doesn’t answer the next one: how you actually win your share of it. A precise TAM won’t fix a weak GTM motion, and a rough TAM won’t sink a sharp one, but you need both pieces to build a plan investors and your own team can trust.
That’s a different exercise: turning a TAM number into a plan for reaching the right customers first.
______________
Marketing shouldn’t run on guesswork.
StepUp embeds senior marketing leaders and a full-stack team inside B2B companies, and installs the operating system that makes marketing plannable, executed, and measured, not just busy. It’s not a campaign, and it’s not a retainer. It’s a department your team owns, long after we’ve stepped back.
If marketing is busy but nothing is moving, what would it take to find out why?
Let’s talk.