The Types of Marketing Professionals: A Field Guide for CEOs and the People Who Work With Them

Most marketing problems inside a company are relationship problems wearing a job title.

A CEO briefs a brand strategist the way she’d brief a designer, and gets a logo when she needed a position. Likewise, a VP Product treats the product marketer as a copywriter with a launch calendar. Someone senior is hired to build a department and spends eight months receiving tasks, then leaves. Yet nobody in any of those stories is bad at their job. The wiring is wrong.

This guide is about the wiring. For every kind of marketing professional: what they own, how you should work with them if you’re the CEO, how you should work with them if you’re a peer running sales or product, and whether they belong inside your company or outside it.

What job titles hide

Two people can hold the same title and be doing entirely different jobs. The thing that separates them isn’t years, and it isn’t the org chart. It’s how far their decisions reach.

Specialists own a craft. The question they answer best is how. How do we get this page ranking. How do we cut cost per lead in half. Hand them a clear problem and a real standard, and they will beat anyone in the building at that one thing.

Function owners own an outcome. The question they answer best is what, and by when. What produces pipeline next quarter. What this launch needs to land. They direct specialists, run a budget line, and answer for a result — inside a scope that stops at the edge of their function.

By comparison, department builders own the system everything else runs inside. The question they answer best is why this and not that. What marketing is for. What it measures. Who gets hired, in what order. What the company stops doing. Every company has exactly one of these, and if nobody was hired for it, it’s the CEO, doing it in the margins of another job.

Where the three get mixed up

Almost every leadership-level frustration with marketing is one of these three mismatched. A function owner promoted into a builder’s seat, still executing because that’s what they know. Or a builder hired to run a channel, restless by month four and gone by month twelve. A specialist handed a strategy question they were never equipped to answer, giving a confident answer anyway because somebody had to.

It shows up in the numbers. The average Fortune 500 CMO lasts 4.3 years, against 4.9 for the C-suite as a whole. Indeed, marketing is the seat that turns over fastest, and being wired in at the wrong altitude is a large part of why.

Altitude doesn’t cost you depth

There’s a lazy version of this map where the people at the top are pure orchestrators — fluent in meetings, no craft left, forwarding the real questions to the real practitioners. That version describes a specific kind of failed executive. It does not, however, describe the job.

Altitude is what depth becomes when you’ve accumulated enough of it. After all, nobody arrives at the top of marketing as a generalist. Instead, they arrive as a writer, or a demand gen lead, or a brand strategist, or the person who rebuilt the attribution model — and then they kept going and added the rest. Fifteen years in, a good one has two or three disciplines they can still personally out-execute their own team in, and enough working knowledge of the others to know within ten minutes when they’re being sold something.

Ultimately, that accumulation is the whole reason their judgment is worth anything. By contrast, breadth on its own produces an administrator who can’t tell good work from expensive work. Depth on its own, meanwhile, produces someone who over-funds their own specialty and starves everything else. The combination — real range, real depth, real scars — is what you’re actually buying at the top of a marketing organization, and it takes a long time to make.

Message, brand and voice don’t get delegated

Here’s the mis-wiring that costs companies the most: treating positioning, messaging, brand and tone as craft work to hand off.

They aren’t deliverables. Instead, they’re the system itself — the thing every campaign, page, deck and sales call derives from. Instead, the person who owns the marketing system owns them, full stop. A CMO who has outsourced what the company sounds like has outsourced their actual job, and you’ll see the result within two quarters as every channel starts saying something slightly different.

Of course, senior people absolutely bring in help. A brand strategist for a repositioning. Or a researcher for the customer language. A naming specialist, a voice writer, an analyst to pressure-test a claim. But that’s a consult, the way a surgeon consults a radiologist — the input sharpens a decision that stays firmly with the person accountable for it. And often enough the CMO is the specialist in the room, because brand or messaging or measurement is one of the deep areas they came up through. Naturally, being able to do the work yourself doesn’t oblige you to do all of it. Rather, it’s what lets you direct it.

Trust the judgment. Ask for the defense.

Still, trusting a senior person is not the same as taking their word for it. The test is whether they can defend any choice they’ve made, on the spot, in two registers:

Pattern. “I’ve watched this fail at three companies and it fails the same way each time — here’s the shape of it.” That’s fifteen years of watching things break, compressed into a call you get to make in thirty seconds instead of eighteen months.

Proof. “Here’s the evidence behind it. Here’s what I’d expect to see by March. And here’s the number that would tell us I’m wrong.”

Either one alone should worry you. All pattern and no proof is instinct with a résumé attached. Conversely, all proof and no pattern is somebody reading you a dashboard. Proof and pattern combined? They’re the thing you can’t hire cheaply, and the thing that makes it safe to stop worrying, second-guessing and supervising.

One more marker: a genuinely senior person will change their position when the evidence turns, and they’ll and say so out loud. That’s the system working, and a confident leader showcasing their expertise. What should worry you is the leader who sticks to their guns despite evidence and who can’t articulate why they’re doing so.

Worth sitting with: if you find yourself second-guessing your marketing lead’s subject lines and colour choices, one of two things is true. You hired the wrong person, or you’re spending your time at the wrong altitude.

Five ways to work with someone

Once you’ve hired the right person, you’ve got to understand your relationship and execute your leadership properly. The wrong relationship can send departments spiraling. Figure out what the appropriate dynamic is and stick with it. And be thoughtful. If you pick the wrong mode you could paralyze or undermine even the most senior leaders.

Partner. You bring the business problem. They bring the answer. You argue it out and decide together. This is for department builders — anyone you’d want contradicting you in front of the board.

Direct. You agree the outcome and the deadline. They pick the method. You review results, not steps. This is how you work with function owners.

Brief. Then you supply context, audience and the standard for good. They produce. You respond to the work. This is how you work with specialists.

Commission. You buy defined work against a written spec. Deliverable in, deliverable out. Most outside vendors.

Route. You don’t manage them directly at all. You go to whoever owns their function. This one applies whenever a CEO is tempted to Slack a specialist, which is most weeks.

Pro Tip for CEOs on the “route” method. When a CEO briefs a specialist directly, the specialist always says yes — you’re the CEO, no one wants to say no to you. The work gets done, great, but then their actual manager finds out afterwards. This can undermine authority and disrupt workflows. Try to avoid this. If you really want something fast, ask the function owner for it fast.

Inside or outside — ask this last

Knowledge, altitude and function come first. Get those wrong and where the person sits is irrelevant.

Once they’re right, here’s what changes. Inside buys context and continuity: someone who knows how your company argues, what you mean when you say “premium,” which customer stories are safe to tell. They also carry political weight, which decides everything cross-functional. Outside buys range and candor: someone who has watched thirty companies solve this, who starts faster, and who can say the uncomfortable thing because their salary doesn’t depend on the answer. More per hour, less per year.

The rule that holds up: buy craft outside, build judgment inside. Specialist execution outsources beautifully. Anything that needs deep knowledge of your company — narrative, positioning, hiring, what to kill — belongs inside, or in a fractional arrangement designed to leave the system behind if it ends.


The roles

Chief Marketing Officer

Altitude: Department builder
If you’re the CEO: Partner. Your peer, not a report with extra steps.
If you’re a peer VP: Partner. Align quarterly on plans. Don’t hand them work.
Where they sit: Inside. Fractional if you prefer not to fund the full-time seat.

The CMO builds marketing as a system, holds the company’s message, and answers for both to the rest of the executive team.

They own the narrative — one documented answer to what the company is, who it’s for, and why it wins, that everything downstream derives from. The department design is theirs too: which roles exist, in what order, what’s in-house, what’s bought, what’s automated. They also own measurement, which mostly means deciding what to stop measuring. So is the operating rhythm — quarterly objectives, weekly check-ins, and a straight answer every Monday to whether the needle moved. Similarly, they own the budget and the trade-offs that fund it. And they translate marketing into language a CFO makes decisions with, and company strategy back into direction the team can act on.

And they own AI at the system level. Not which tools to buy — which parts of the engine AI runs, what standard its output is held to, who reviews it, and how the whole thing stays coherent while producing several times as much.

What a CMO needs from you

The real business problem and the real constraints. Revenue targets, cash position, where the board is nervous, what you’re afraid of. Do not give them a task list. Give a department builder a task list and you’ve bought a very expensive project manager.

VP Marketing

Altitude: Builder in a small company, function owner in a large one
If you’re the CEO: Direct, moving toward partner as trust builds.
Where they sit: Inside.

A VP Marketing runs the team and hits the plan. A CMO, by contrast, writes the plan, holds the narrative, and sits where company strategy gets decided. At thirty people that’s one person wearing both. At three hundred, though, it rarely is. If you’re recruiting a “VP Marketing” and expecting them to define what the company stands for, you’re recruiting a CMO and underpaying for it.

Fractional CMO

Altitude: Department builder
If you’re the CEO: Partner, on a clock.
Where they sit: Outside, deliberately.

The same altitude as an internal CMO, bought part-time, for when the company needs the architecture — narrative, structure, metrics, hiring plan and leadership, but runs lean, agile or remote.

Product Marketing Manager

Altitude: Function owner
If you’re the CEO or CMO: Direct or Brief. Agree the launch outcome, determine the working relationship on a case-by-case basis.
If you’re a VP: Direct. This is your closest counterpart in marketing, trust their judgement so long as the plans are signed off by the CMO.
Where they sit: Inside. Notably, the role runs on product and customer knowledge that takes months to build, they’re a great counterpart to a Fractional CMO for this reason.

(PMMs are chronically undervalued. A strong PMM is often the only person in the building who can describe the product in the customer’s own words, and the difference between a launch with one and a launch without one is visible from across the company).

Where the confusion starts

The PMM works with product, sales, content, demand gen and support, so from outside the role looks like leadership. It isn’t the same thing. The scope is a product, a launch calendar and a sales team to equip — inside a roadmap someone else sets and a company narrative someone else holds. Coordinating across teams and being accountable for the system are different jobs, and conflating them is how companies end up with a very good manager in a seat that needed a builder.

The clean test: ask about the company narrative. A product marketer will describe messaging for their product, well. A department builder will describe the story the whole company tells, and then show you where the product messaging hangs off it.

What they need from you: roadmap visibility, direct access to customers, and a settled company narrative to work inside. Ask a PMM to invent that narrative between launches and you’ll get positioning for a product, applied to a company. It’s the single most common reason, therefore, that a company’s message reads like a feature list.

PMM vs Product Manager: the PM owns what gets built. Meanwhile, the PMM owns how it’s explained, launched and sold. (A distinction necessary only for very large companies).

Brand strategist

Altitude: Function owner, working under the marketing lead’s ownership of the message
If you’re the CEO or CMO: Partner during a repositioning, brief for execution — and route the final call through whoever owns your narrative.
Where they sit: Fractional or outside for the strategic sprint, outside for execution. Some CMOs are also brand strategists.

A brand strategist works on what the company means to people who aren’t buying today: the positioning story, the identity, the voice, the consistency of it everywhere.

Note the altitude carefully, because this is where companies most often mis-wire. Bringing in a brand strategist doesn’t transfer ownership of the message — it buys concentrated expertise for a decision your marketing lead still owns and still has to defend. In plenty of companies the CMO is the stronger brand thinker of the two and hires the specialist for execution horsepower and an outside read. Both arrangements work. What doesn’t work is a brand project that runs around the person accountable for the narrative, which produces a beautiful deck nobody’s marketing actually uses.

Brand is also the hardest discipline to prove on a quarterly cycle, which is why it’s cut first and missed longest. Nevertheless, good brand people tie it to commercial reality without pretending the attribution is cleaner than it is. Be wary of certainty here, and equally wary of anyone who uses the difficulty as an excuse to avoid numbers altogether.

Demand generation manager

Altitude: Function owner
If you’re the CEO or CMO: Direct. Agree the pipeline number and the budget. Leave the channel mix alone.
If you’re the VP Sales: Partner. You two either agree on what a good lead is, or you blame each other indefinitely.
Where they sit: Inside, with outside execution help.

Owns the programs that produce qualified pipeline: campaigns, paid channels, webinars, nurture, scoring, and the handoff to sales. Answers for pipeline volume, quality and cost.

The classic failure is a demand gen lead optimising toward a target sales can’t actually work. That’s almost never their fault — it happens when nobody above them reconciled the pipeline number with the capacity to follow it up.

What they need from you: a defined ideal customer, an agreed definition of a qualified lead, and a sales team that responds. Without the first two, they’ll hit the number and none of it will convert.

Growth marketer

Altitude: Specialist, sometimes function owner
If you’re the CEO or CMO: Direct — and protect their right to run experiments that fail.
Where they sit: Inside. The work needs product access.

Experiment-driven, working across acquisition, activation and retention rather than one channel. Heavy on analytics and product-adjacent work: onboarding, funnels, in-product prompts. Most at home where the product itself is a channel.

In long-cycle B2B, “growth marketer” is frequently demand gen with a newer title. So it’s worth checking which one you’re getting before you build a team around it.

Performance / paid media marketer

Altitude: Specialist
If you’re the CEO: Route. Go through demand gen or CMO. CEOs in ad accounts is a well-documented way to burn money.
Where they sit: Outside, usually. Platform depth is a craft, and an agency sees more accounts in a month than you will in a decade.

Owns paid channels and their economics: cost per acquisition, spend efficiency, channel mix. Deeply technical inside the platforms, and genuinely fast when the inputs are right.

Their results depend entirely on someone else having defined the audience and the message correctly. So when paid performance disappoints, look hard at the positioning before you replace the person.

Content marketer

Altitude: Specialist, rising to function owner when they own the architecture
If you’re the CEO: Brief or Route. Your thinking is the scarce input here. Your edits aren’t.
Where they sit: Strategy inside, production outside. The cleanest split in marketing.

At specialist level: writes and publishes. At function-owner level: owns a content architecture where every piece maps to a buyer question and a business objective — and can tell you why something shouldn’t be written at all.

What they need from you: thirty minutes of your real thinking, not a review cycle. Executives who give content people access to their genuine opinions get content worth reading. By contrast, executives who only give edits get bland work, and then complain about it.

SEO specialist

Altitude: Specialist
If you’re the CEO: Route, through content or marketing leadership.
Where they sit: Outside, or one person inside directing outside execution.

Owns organic visibility: technical health, site structure, keyword and topic strategy, internal linking, and increasingly whether AI answer engines cite you at all. Distinct from content marketing, and both fail badly when they operate separately.

Lifecycle / CRM marketer

Altitude: Specialist to function owner
If you’re the CEO: Direct if retention is a live problem. Otherwise route.
Where they sit: Inside. They live in your customer data.

Owns everything after the first touch: onboarding, nurture, retention, reactivation, and the segmentation underneath it all. Usually knows the CRM better than anyone else and is the only person who can explain why the data looks the way it does.

Marketing operations

Altitude: Function owner, load-bearing
If you’re the CEO: Direct — and take their objections seriously. When MOps says the data won’t support the report you want, they’re right.
Where they sit: Inside. Implementation projects outside. Often the CMO is wearing this hat as well especially in smaller B2Bs.

Owns the plumbing: tech stack, data hygiene, lead routing, attribution, reporting infrastructure, integrations. Invisible until it’s missing, at which point every dashboard disagrees and nobody can say what produced pipeline.

Pro Tip: Any marketing leader who can’t hold a real conversation with their MOps person will eventually present numbers that don’t make sense.

Field marketer and partner marketer

Altitude: Function owner
If you’re the CEO: Direct. Expect to see them at customer events beside you.
If you’re the VP Sales: Partner. Field marketing is closer to your team than to marketing’s.
Where they sit: Inside, regionally. Event logistics outside.

Field marketing owns regional and in-person programs: events, roadshows, local campaigns, tight alignment with regional sales. Partner marketing owns co-marketing with resellers, integration partners and alliances. Both are relationship businesses, and both are undervalued in enterprise selling.

Communications and PR

Altitude: Specialist to function owner
If you’re the CEO: Partner in a crisis, brief the rest of the time.
Where they sit: Outside for reach and media relationships. Inside once you need someone reachable in ten minutes.

Owns earned attention: press, analysts, executive visibility, and what happens on the bad day. A different muscle from demand generation, a slower clock, and usually a different personality in the room.

Marketing analyst

Altitude: Specialist
If you’re the CEO: Brief — and ask for the answer you don’t want.
Where they sit: Inside, or shared with the wider data team.

Owns measurement itself: models, dashboards, and the uncomfortable conclusions. Folded into MOps in small teams; separating the two is what ends attribution arguments.


Where AI sits in all of this

The common assumption is that AI eats this map from the bottom — specialists get automated, everything above carries on unchanged. The first half is partly true. The second half, however, is wrong, and it’s the half that determines how you should organise.

What AI really changes is the ratio between producing and judging. Drafts, variants, reports, first-pass analysis: nearly free now. Deciding what should exist, what standard it’s held to, and what to do when it’s wrong: exactly as hard as it ever was, and now the bottleneck.

The adoption question is settled. McKinsey’s 2025 survey puts organisational AI use at 88%, up ten points in a year, with marketing and sales the function where generative AI is used most. Everyone has the tools. That was never the hard part.

Why strong managers make strong AI managers

Which leads somewhere people find counterintuitive. The strongest people managers turn out to be the strongest AI managers. It’s the same skill set, close to line for line.

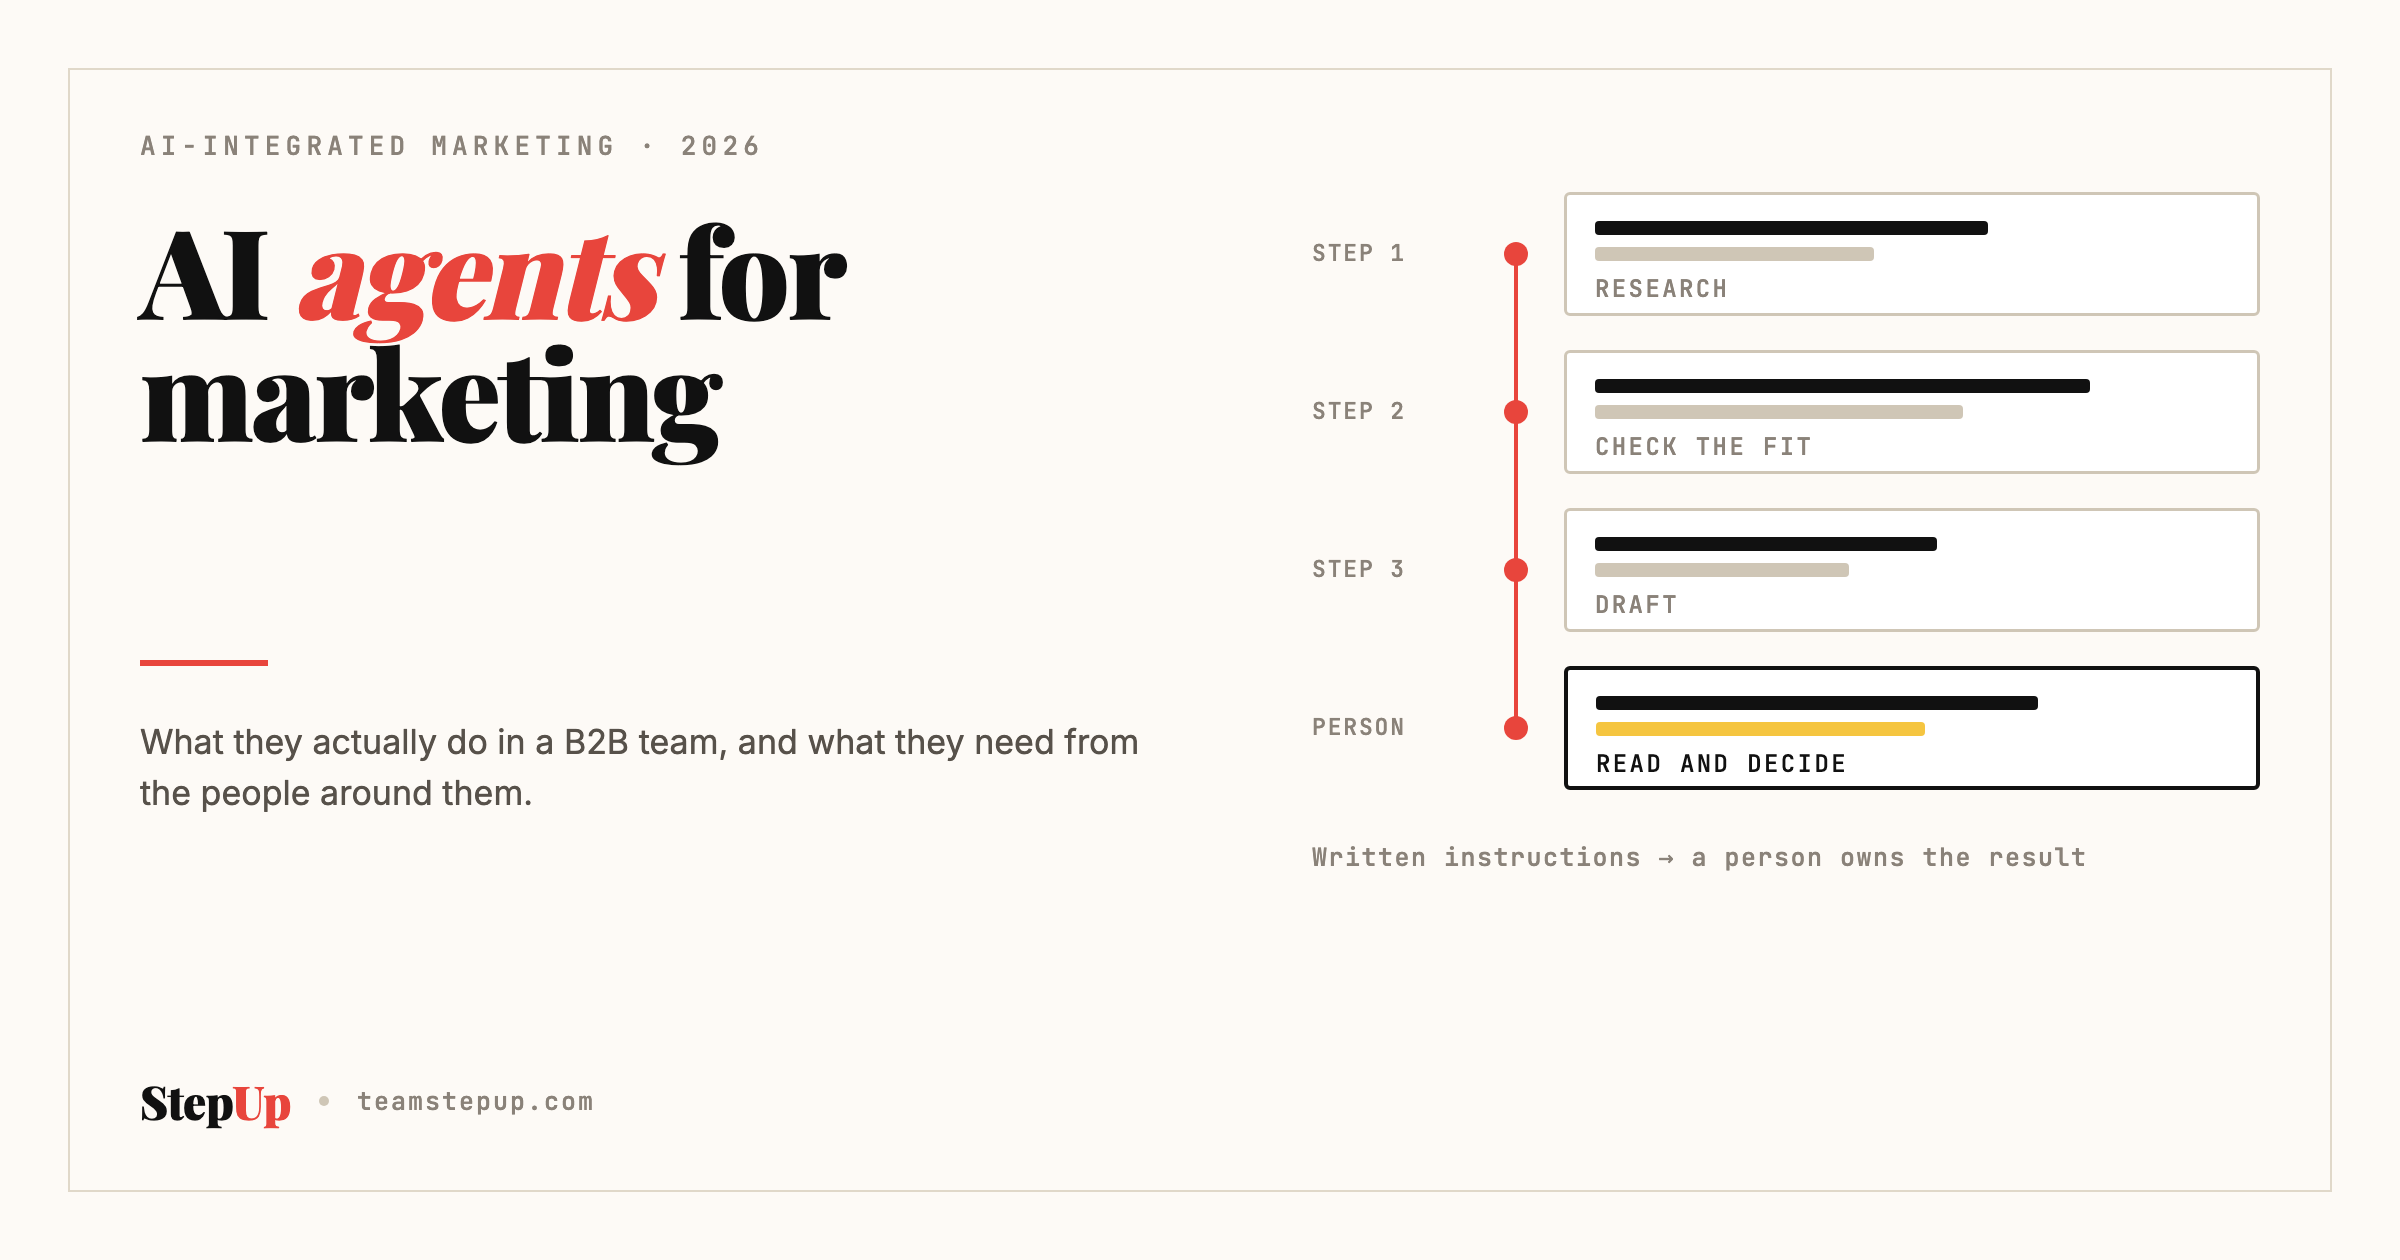
Managing a capable person well means writing a brief that survives contact with reality. Giving context instead of instructions. Defining what good looks like before the work starts. Reviewing against that standard rather than your mood that afternoon. Recognising a confident answer that’s wrong — which you can only do in a discipline you actually know. Building a loop so the same mistake doesn’t reappear next month.

Every one of those is what running AI systems well requires. And notice the one in the middle: catching the plausible wrong answer takes real depth in the subject. This is where the accumulated expertise of a senior marketer stops being a nice-to-have. AI produces work that looks right. Only someone who has done the work can tell you it isn’t.

The inverse, meanwhile, is easier to watch happen. Managers who never learned to delegate — who hand over tasks with no context, accept work because it’s polished, and can’t articulate a standard — get exactly the result from AI they always got from people. Fast output, wrong direction, and a growing pile of rework nobody owns.

AI integration is a leadership question, not a procurement one

So AI integration is a leadership question, not a procurement one. Anyone can buy the tools, and most companies already have. What decides whether it works is which parts of the system AI runs, what the review standard is, who owns the output when it’s wrong, and how the whole thing stays coherent while producing three times the volume. Those are the same decisions a department builder makes about people, applied to a faster and considerably more literal kind of worker.

If your AI marketing effort has produced volume and no clarity, the tools aren’t the problem. Look at the altitude and the depth of whoever is managing them.


Three questions that show you someone’s altitude in ten minutes

“What did you kill, and how did you decide?” Builders have a list, and the cost of each one. Function owners have one example inside their own scope. Specialists have none, because killing things was never theirs to do.

“Show me how your metrics connect.” Ask for the line from a weekly team number all the way up to something the board sees. A builder draws it in one breath. Everyone else describes their dashboard.

“Defend a choice I might disagree with.” You’re listening for both registers — the pattern from experience and the proof from evidence, plus the number that would change their mind. One without the other is half a leader.

A closing note on shape

You’ll hear people described as T-shapeda term David Guest coined in 1991, and one IDEO’s Tim Brown made standard: broad working knowledge across marketing, with real depth in one or two areas. It matters more the higher you go, because leading marketing means making trade-offs between disciplines. Only depth, and you over-fund your own specialty. Only breadth, and you can’t tell competent work from expensive work — something specialists detect inside a month.

The variants are worth knowing. I-shaped is deep in one area and narrow elsewhere: excellent specialists, rarely happy running a department. Generalists are broad with no strong stem: invaluable in an early-stage company where one person does everything, ceiling-bound as soon as the team grows. M-shaped people carry several deep areas plus breadth, usually built across fifteen or more years and several stages of company. Those are the people who build departments out of nothing, because they’ve personally done enough of the jobs to know how the pieces fit — and because they can still sit down and do any one of them when it matters.

None of this ranks anyone’s worth. After all, a brilliant specialist beats a mediocre executive on almost any given day. It’s a map of scope and of accumulated judgment, and those are the two things a job title reliably hides.

Frequently asked questions

What are the main types of marketing professionals?

Marketing roles fall into three altitudes rather than a flat list of titles. Specialists own a craft and answer how — SEO, paid media, content, analytics. Function owners own an outcome and answer what, and by when — product marketing, demand generation, lifecycle, marketing operations, field and partner marketing, communications. Department builders own the whole system and answer why this and not that — the CMO, the fractional CMO, and a VP Marketing in a smaller company.

What is the difference between a CMO and a VP Marketing?

A VP Marketing runs the team and hits the plan. A CMO writes the plan, holds the company narrative, and sits where company strategy is decided. In a thirty-person company that is often one person doing both. In a three-hundred-person company, however, it rarely is. Recruiting a VP Marketing and expecting them to define what the company stands for means recruiting a CMO and underpaying for it.

How should a CEO work with their marketing team?

Match the working mode to the altitude. Partner with department builders: bring the business problem, decide together. Direct function owners: agree the outcome and the deadline, review results rather than steps. Brief specialists: supply context, audience and the standard for good, then respond to the work. Commission outside vendors against a written spec. And route around specialists you do not manage — ask the function owner, not the practitioner.

Should marketing roles be hired in-house or outsourced?

Ask this last, after knowledge, altitude and function. The rule that holds up is buy craft outside, build judgment inside. Specialist execution — paid media, SEO delivery, content production, event logistics — outsources well. Anything that needs deep knowledge of your company, such as narrative, positioning, hiring and what to kill, belongs inside, or in a fractional arrangement designed to leave the system behind when it ends.

What is a fractional CMO, and when does it make sense?

A fractional CMO is department-builder altitude bought part-time, for a company that needs the architecture — narrative, structure, metrics, hiring plan — before it can justify a full executive salary. Judge them on what survives their exit. If the system keeps running after they leave, it worked. If everything stalls the week they stop invoicing, you bought labour and called it leadership.

Does AI replace marketing specialists?

AI has made producing nearly free — drafts, variants, reports, first-pass analysis. It has not made judging any easier, and judging is now the bottleneck. Catching a confident but wrong AI answer requires real depth in the subject, which is exactly what an experienced marketer has. The strongest people managers turn out to be the strongest AI managers, because writing a brief, defining a standard and reviewing against it are the same skills either way.


If reading this map made you realise the mis-wiring is in your own company — the wrong altitude in a seat, or the right person being briefed the wrong way — that is a structural question, not a hiring one. It is the first thing we look at when we build a marketing system for a company. What would change if the person holding your message were sitting at the right altitude?

AI in B2B Marketing: An Operator’s Playbook for 2026

AI in B2B marketing uses machine learning and predictive models to do three jobs marketers once did by hand. It analyzes account and buyer signals, generates content variations, and decides who to target and when. Everything else is a variation on those three verbs.

Most articles about AI in B2B marketing read like a vendor’s product tour with a few stats bolted on. They tell you AI can “personalize at scale” and “surface intent signals,” then push you toward a platform demo. What they don’t tell you is how AI earns its place inside a working go-to-market motion. It has to sit somewhere specific: your ICP definition, your content pipeline, your ABM plays, your TAM math. You also need a way to keep the output from sounding like every other AI-generated blog post on the internet.

This is that guide. We’re a GTM execution agency, not an AI vendor. We have no platform to sell you, so we can tell you the truth about what works and what doesn’t. That includes where the “loss of human connection” problem everyone name-checks actually comes from. Hint: it isn’t the AI’s fault.

What This Guide Covers

By the end of this piece you’ll have:

  • A clear, jargon-free definition of what AI in B2B marketing actually means in 2026
  • A function-by-function breakdown of where AI is genuinely earning its keep (and where it’s theater)
  • A vendor-neutral map of the tool landscape, organized by GTM function instead of by which company paid for the “best of” listicle
  • A real, anonymized client example showing AI embedded at three different GTM stages with actual before/after numbers
  • A concrete method for fixing “AI content sounds robotic” — not just a warning that it can
  • An AI-Integrated GTM Maturity Model you can use to self-assess where you are today
  • A step-by-step implementation framework tied back to ICP, TAM, and GTM strategy — not a standalone AI initiative floating apart from the rest of your marketing

What Is AI in B2B Marketing?

AI in B2B marketing covers three jobs a marketing team used to do entirely by hand. Analyze signals about accounts and buyers. Generate content and creative variations. Decide, in real time, who to target and what to say to them.

That’s it. Strip away the hype and AI in B2B marketing collapses into those three verbs: analyze, generate, decide.

One distinction matters more than the rest, and almost every other article glosses over it. It’s the difference between AI as a bolt-on tool and AI as an integrated layer of your GTM system. A bolt-on tool means someone on your team uses ChatGPT to draft blog outlines. An integrated layer means your ICP data, intent signals, content engine, ABM sequencing, and lead scoring all feed each other through AI. That happens continuously, with nobody re-keying data between five different tabs.

Most companies are doing the first. The ones winning right now are doing the second. That gap — not access to the technology itself, since everyone has access to the same handful of tools — is what separates AI-integrated marketing from AI-decorated marketing.

We use the term AI-integrated marketing deliberately instead of “AI marketing” for this reason. AI marketing implies AI is the strategy. AI-integrated marketing means AI is embedded inside a strategy that already exists — your GTM strategy, built around a real ICP and a real TAM. That strategy then executes faster and targets more sharply than a human-only team could manage.

How AI Is Used Across B2B Marketing Functions

AI’s usefulness varies enormously by function. Some of this is genuinely transformative. Some of it is still better done by a person. Here’s the honest breakdown, function by function.

AI in Content Marketing and Creation

This is where AI gets the most attention and, frankly, causes the most damage when misused. AI can draft outlines, generate first-pass copy, repurpose long-form content into social posts and email snippets, and summarize research at a speed no writer can match.

What it can’t do on its own is sound like you. Generic prompting into a generic model produces generic output — which is exactly why AI Overviews and search results are now saturated with interchangeable, forgettable B2B content. We’ll cover the actual fix for this in the “loss of human connection” section below, because it’s solvable, and almost nobody explains how.

Where AI genuinely earns its place in content workflows:

  • Research synthesis. AI pulls themes out of interview transcripts, call recordings, and review comments faster than a human could read them.
  • Draft velocity — turning a structured brief into a first draft in minutes instead of hours, freeing a writer’s time for the editing pass that actually matters
  • Repurposing — turning one pillar asset into a dozen distribution formats without a dozen separate writing projects
  • SEO structural work — mapping search intent, clustering keywords, and identifying content gaps against competitors at a scale manual research can’t match

AI in Account-Based Marketing (ABM)

AI has changed ABM more than almost any other function. ABM has always been a data-matching problem at its core: which accounts look like our best customers, and what signals tell us they’re in-market right now.

Predictive account scoring models now ingest firmographic data, technographic data, intent data, and engagement history. They rank accounts by propensity to buy, updated continuously rather than quarterly. AI-driven ABM platforms can also auto-generate account-specific messaging variants. They identify the “buying committee” too — the cluster of individuals at a target account genuinely influencing the decision — well before a sales rep would spot them manually.

AI in Lead Scoring and Predictive Analytics

Traditional lead scoring was a static point system: download a whitepaper, get 10 points; visit pricing page, get 20 points. It was crude and it aged badly. AI-based predictive lead scoring instead trains on your actual closed-won and closed-lost history to find the real patterns — which often aren’t the ones marketers assume. We’ve seen models surface an unexpected combination: job title plus company size plus a single content download. It predicted conversion far better than the “high engagement” leads everyone assumed were hottest.

This matters enormously for TAM and ICP work: predictive scoring is only as good as the ICP definition feeding it. Garbage ICP in, garbage lead scoring out — which is why this function can’t be separated from your foundational GTM strategy work (more on this in the implementation section).

AI in Personalization at Scale

AI enables 1:1 personalization across web experiences, email sequences, and ad creative. It works at a granularity no human team could manage by hand. Landing pages shift headline and proof points based on the visitor’s industry. Email send times optimize per recipient. Ad creative rotates toward whichever variant a specific account segment responds to.

The risk here is the uncanny valley of personalization: name-merge-field emails that technically say “Hi {FirstName}” but clearly weren’t written with any real understanding of that account’s situation. Real personalization requires the underlying data (ICP segments, account research, buying stage) to actually be good — AI amplifies whatever strategy is underneath it, for better or worse.

AI in Email Marketing and Nurture

AI now handles subject line testing, send-time optimization, dynamic content blocks based on lifecycle stage, and predictive churn/re-engagement flags for dormant leads. This is one of the lowest-risk, highest-ROI applications of AI in the entire B2B stack. Email is a closed, measurable channel, so you can A/B test and iterate with real data almost immediately.

AI in SEO and Search

AI tools now handle keyword clustering, content gap analysis, and structured data generation. Increasingly they also optimize directly for AI Overviews and answer engines rather than traditional blue-link SERPs. This last point deserves attention. More B2B research now happens inside AI chat interfaces than on search results pages. Being cited as a source inside an AI-generated answer has become its own optimization target, separate from ranking position. We built the FAQ section of this very article with that in mind.

The Benefits of AI-Integrated B2B Marketing

AI adoption in B2B marketing has moved fast, from early-adopter experimentation to default practice in a couple of years. Marketers using it consistently report gains in content output volume and campaign turnaround time. Efficiency, not creativity, remains the number one reported benefit — teams are producing more variants, more segments, and more campaigns in the same headcount, not necessarily better strategy.

That’s an important distinction: the data consistently shows AI amplifies execution speed. It does not, on its own, improve strategic clarity. Every survey report on this topic buries that nuance under the headline efficiency number. That’s exactly why the “AI in B2B marketing” conversation keeps producing thin, stat-heavy articles with no execution framework behind them. Speed without direction just gets you to the wrong place faster.

The real, durable benefits we see across GTM-integrated deployments:

  • Faster time from research to launch. The ICP-to-content-to-campaign cycle drops from 4-6 weeks to 1-2 when AI handles synthesis and first drafts.
  • Better signal-to-noise in targeting — predictive scoring surfaces accounts sales would have deprioritized manually
  • Content volume without proportional headcount growth — a lean team can now sustain a publishing cadence that used to require double the writers
  • Faster feedback loops — AI-assisted analytics shorten the time between “we tried this” and “here’s what happened,” letting teams iterate weekly instead of quarterly

Limitations and Challenges

Every top-ranking article on this topic lists these limitations as a paragraph of caveats. None of them tell you how to actually solve them. Here’s the honest version.

Data Quality Is the Real Bottleneck

AI models are only as good as the data they’re trained and run on. Say your CRM has duplicate records, inconsistent firmographic tagging, and a lead source picklist nobody’s cleaned up in two years. Your predictive scoring model will confidently produce garbage. Because it’s a model rather than a spreadsheet formula, that garbage will look authoritative. We’ve walked into engagements where the single highest-leverage AI project wasn’t a new tool at all — it was a CRM data hygiene sprint that had to happen first.

The fix: before any predictive AI investment, audit your source-of-truth data — lead source attribution, firmographic completeness, deduplication — and lock down your data model. This is unglamorous and it’s also the actual prerequisite everyone skips.

Over-Reliance and the Erosion of Judgment

The failure mode isn’t “AI made a bad decision.” It’s “the team stopped checking AI’s decisions.” Lead scores, content recommendations, and audience segments all flow through automated models. A team can lose the muscle of asking the obvious question: does this actually make sense for our ICP? AI should compress the time to a decision. The judgment about whether the output is right stays with a person.

The fix: build a standing review cadence — even fifteen minutes weekly — where a human GTM owner spot-checks AI-driven scoring and targeting decisions against real deal outcomes. Treat AI outputs as a strong first draft of a decision, not the decision itself.

Loss of Human Connection — And How to Actually Fix It

This is the limitation every single competing article names and none of them solve. “AI content can feel generic” is treated as an inherent, unfixable property of AI. It isn’t. It’s a symptom of a specific, correctable input problem: generic prompts produce generic output because most teams never give the model anything specific to say.

Here’s the method that actually works, and it’s the one we use with every client:

The Three-Step Fix for Generic AI Content

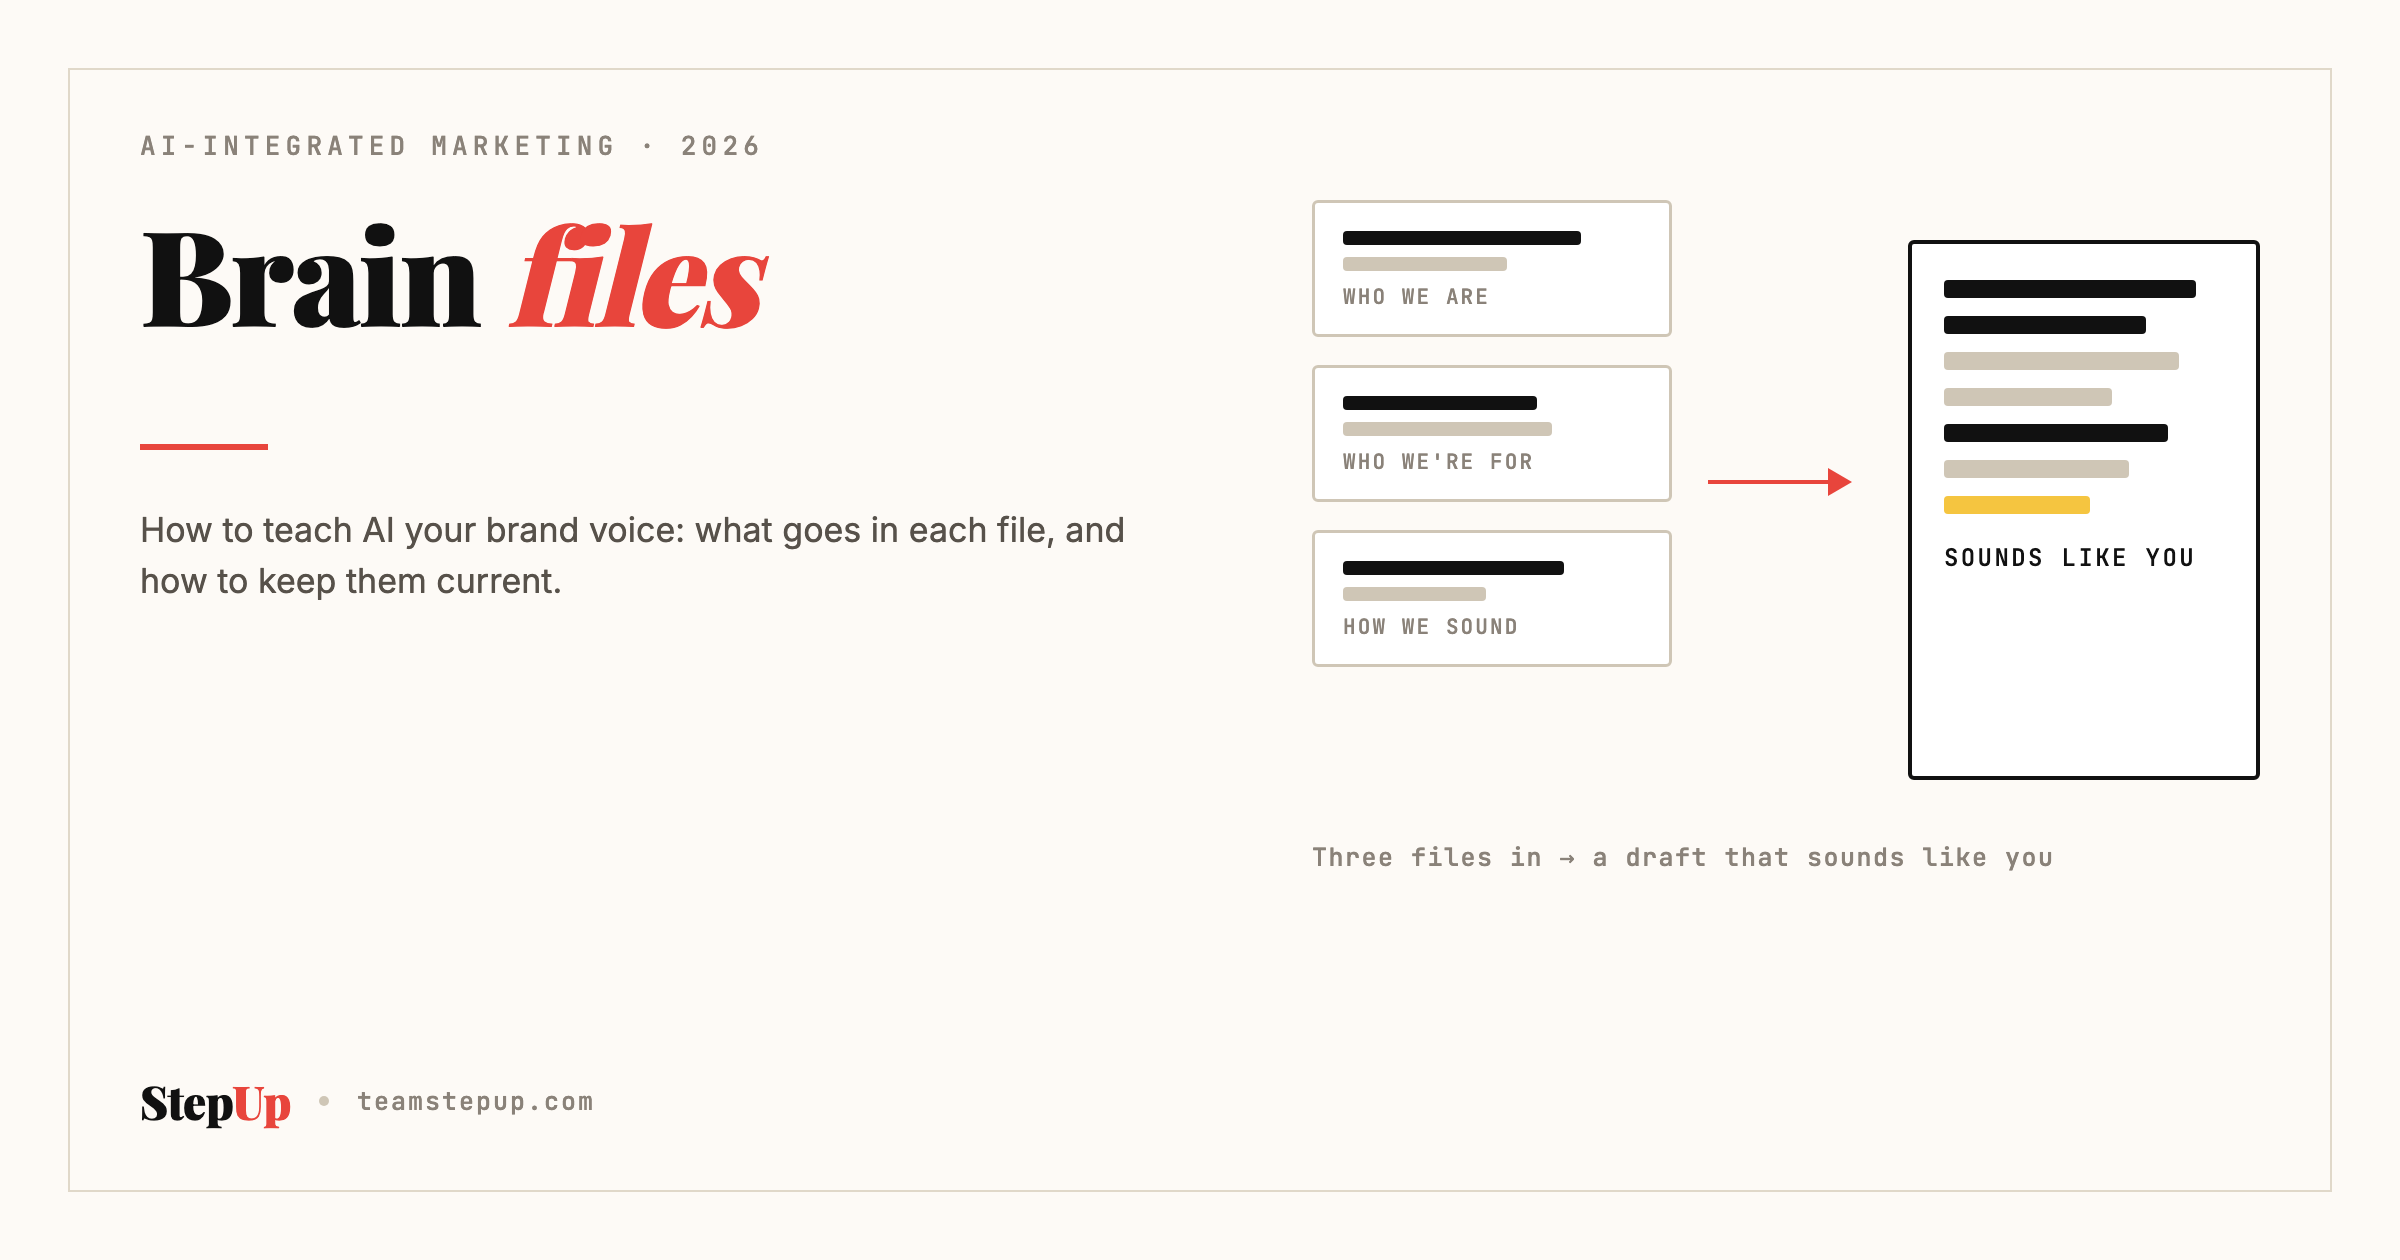
  1. Build a narrative foundation before you generate anything. Before AI ever writes a word, we compile a structured knowledge base. It holds customer language pulled directly from sales calls and reviews, the client’s positioning and point of view, the real objections prospects raise, and the proof points that differentiate them. We call this a brain file. Without it, an AI model defaults to the statistical average of everything ever written about your topic — which is precisely why so much AI content sounds the same. With it, the model has something specific to draw from instead of generic industry-speak.
  2. Generate from that foundation, not from a bare prompt. “Write a blog post about AI in B2B marketing” produces filler. “Write from this positioning, using this customer language, making this specific argument, with this proof point” produces something that sounds like a person who knows the subject.
  3. Always close with a human edit pass focused on specificity, not grammar. The edit that matters isn’t fixing typos — it’s stripping out every sentence a competitor could publish word-for-word and replacing it with something only your company could credibly say.

Skip step 1 and no amount of prompting cleverness in step 2 will fix it. This is the actual answer to “why does AI content feel robotic” — and it’s the reason a genuinely narrative-first, GTM-integrated process outperforms a bare AI writing tool every time.

AI Marketing Tools and Platforms (Vendor-Neutral)

Every other article ranking for this term is written by a vendor pushing their own platform through the “best tools” section. We don’t sell software, so here’s the landscape organized by the GTM function it actually serves — not by whose blog you’re reading.

The Tool Landscape by GTM Function

GTM Function What These Tools Do Key Selection Criterion Red Flag
Content Generation & Optimization LLM interfaces, AI writing assistants, and SEO content platforms. They draft, repurpose, and structure content. Can it ingest your own brand and customer data as context? Or does it only generate from generic training data? Output needs a full rewrite, not a light edit. You added a step instead of saving one.
ABM & Predictive Account Intelligence Platforms that combine intent, technographic, and firmographic data into account scoring models. How many data sources it draws on. Also how cleanly the scores flow back into your CRM and ad platforms. You need a manual list export to act on the scores. The “integration” is a spreadsheet.
Lead Scoring & CRM-Native Predictive Tools Predictive scoring built into — or bolted onto — the CRM you already run. What your existing CRM already does natively, before you buy anything standalone. Paying for a point solution that delivers the same 80% your CRM already gives you on clean data.
Personalization & Dynamic Content Tools that change web pages, email content, and ad creative based on who is looking at them. Speed, so personalization does not slow the page down. And whether the segments are genuinely granular. “1:1 personalization” that turns out to be a handful of broad segments.
SEO & Answer-Engine Optimization Keyword clustering, content gap analysis, structured data, and AI Overview visibility tracking. Whether it tracks answer-engine citations, not just blue-link rank. Ask the vendor about their AI Overview roadmap. No answer is the answer.

The Real Selection Criteria

Across every category, the questions that matter more than any feature checklist:

  • Does it integrate with the CRM and data you already have? Or does it need a parallel data model?
  • Can it ingest your own brand/customer context, or only generate from generic training data?
  • Does the output require a full human rewrite, or a light edit? (If it’s the former, you haven’t saved time — you’ve added a step.)
  • Is there a clear owner on your team who will actually maintain it, or will it join the pile of unused logins six months from now?

Buy for the workflow gap you have today, not the roadmap a sales rep shows you in a demo.

Trends and the Future of AI in B2B Marketing

A few shifts are worth planning around now rather than reacting to later:

Answer-engine visibility is becoming its own optimization discipline, separate from traditional SEO. Being the cited source inside an AI-generated answer requires structured, specific, well-sourced content. That holds in ChatGPT, Perplexity, and Google’s AI Overviews alike. Thin, generic filler never gets there. Ironically, the flood of generic AI content is making specific, well-researched content more valuable. It’s what the answer engines have to reach for when everything else is indistinguishable across ten competing sites.

Predictive and prescriptive analytics are converging with execution. Today’s tools mostly tell you which accounts are hot. The next generation increasingly suggests — or auto-executes — the next best action: which sequence to trigger, which ad variant to serve, which rep to route a lead to. The GTM teams that win this transition will be the ones with clean enough data and clear enough playbooks that automated execution is trustworthy rather than reckless.

AI-integrated marketing is becoming a baseline expectation, not a differentiator. The differentiator is shifting. It used to be “do you use AI,” and soon everyone will. The real question becomes whether your AI usage is embedded in a GTM strategy or bolted onto disconnected point tools. That’s the gap this guide has been describing, and it’s only going to widen.

Human specificity becomes the scarce resource. AI-generated content is saturating every category. That makes specific insight the scarce thing: real customer language, real proof points, a real point of view. It’s hard to fake and therefore valuable. Teams that treat AI as a speed multiplier on top of real strategic work will pull further ahead of teams using it as a replacement for strategic work.

A Real Example: AI Embedded Across GTM Stages

Here’s what AI-integrated marketing looks like in practice, from an engagement with one of our clients — a mid-sized industrial equipment manufacturer selling to plant operations and engineering buyers. We’re not naming the client, per our standard confidentiality practice, but the numbers and workflow are accurately represented.

Stage 1: ICP and TAM Refinement

The team came to us with a TAM estimate built on a broad industry code list and no real segmentation of which sub-segments actually converted. We ran AI-assisted analysis of their closed-won deal data, cross-referencing firmographic data, technographic signals, and deal size. One combination stood out. Plant size paired with equipment age converted at nearly 3x the rate of the “average” target account the team had been chasing. That single refinement cut their addressable list by roughly 40% while increasing average deal size in the remaining segment.

Stage 2: Content and Demand Generation

Using the narrative-first method described earlier, we built a brain file from sales call transcripts and customer interviews. It captured the actual language engineering buyers used to describe their problems, which differed sharply from the marketing department’s internal language. Content generated from that foundation was briefed and edited by a human strategist, then drafted with AI assistance. Production time fell by roughly 55%. Organic traffic to the new content cluster grew month over month, because the content used language buyers actually searched for.

Stage 3: ABM and Lead Scoring

With the refined ICP from Stage 1 feeding a predictive scoring model, sales development reps stopped working a flat, unranked list of several hundred accounts. They worked a ranked list instead. Top-quintile accounts converted to opportunity at more than double the rate of the unranked baseline. Reps reported meaningfully shorter time spent per qualified opportunity because they were prioritizing the right accounts instead of working the list top to bottom.

The throughline across all three stages: AI wasn’t a separate initiative. It was embedded inside GTM strategy work that already had a clear ICP and TAM foundation. Remove that foundation and the same AI tools would have simply executed the wrong strategy faster.

AI-Integrated GTM Maturity Model: Where Are You Right Now?

Use this to self-assess before investing further in any AI tool. Most teams overestimate their stage.

Stage What It Looks Like Diagnostic Question
Stage 0
Ad Hoc
People use general AI tools informally. Someone drafts emails in ChatGPT. No shared process, no brand context, no measurement. Is there any shared process at all, or is it whoever remembers to try it?
Stage 1
Point Tools
One or two dedicated AI tools are in place. They run in isolation from each other and from any documented ICP or GTM strategy. Do the tools talk to each other, or does someone re-key data between them?
Stage 2
Embedded Workflows
AI tools connect to clean CRM data and a documented ICP. Content draws on a real narrative foundation. Someone owns the stack and reviews output on a regular cadence. Can you point to a specific ICP document your AI scoring model is built from?
Stage 3
Compounding System
AI sits across the full GTM motion — TAM and ICP, content, ABM, scoring, nurture. Each stage feeds the next. Does better ICP data measurably produce better scoring, and better scoring better-targeted content?

Most B2B marketing teams sit at Stage 1 — they assume adopting a tool means they’ve reached Stage 2 without ever connecting it to real ICP data. If you can’t point to that document, you’re at Stage 1, regardless of how many AI tools are in your stack.

How to Implement AI in Your Marketing Strategy: Step by Step

This is the framework every other article skips in favor of generic “start small, measure often” advice. Here’s the actual sequence, tied back to GTM fundamentals instead of floating as a standalone AI initiative.

Step 1: Fix Your ICP and TAM Foundation First

Before touching any AI tool, get honest about who your best customers actually are — not who you wish they were. Pull your closed-won data, identify the real patterns in firmographics, deal size, and sales cycle length, and use that to sharpen your ICP definition and TAM estimate. Every AI tool downstream — scoring, targeting, content — inherits the quality of this step. Skipping it is the single most common reason AI initiatives underdeliver.

Step 2: Audit and Clean Your Core Data

Check lead source attribution, deduplicate CRM records, and standardize firmographic tagging. This is unglamorous work and it’s the actual prerequisite for any predictive model to produce trustworthy output. Budget real time for this. It’s frequently the highest-leverage week of the entire project.

Step 3: Build Your Narrative Foundation

Compile the knowledge base AI will draw from — real customer language from sales calls and reviews, your actual positioning, your proof points, your competitive differentiation. This is what separates AI-integrated content from generic AI-generated filler, and it’s a one-time investment that pays off across every piece of content you produce afterward.

Step 4: Pick One Function to Integrate First

Don’t try to embed AI across content, ABM, scoring, and email simultaneously. Pick the function where clean data already exists and the strategic foundation is already built. That’s usually content or lead scoring. Get that one workflow fully embedded before expanding.

Step 5: Assign a Human Owner and a Review Cadence

Every AI-integrated workflow needs a named owner who reviews output against real outcomes on a fixed schedule. Content and email deserve a weekly review; ABM scoring can run monthly. This is the guardrail against the over-reliance failure mode covered above.

Step 6: Measure Against Pipeline, Not Just Output Volume

The easy trap is measuring AI success by content volume or email sends — vanity metrics that go up regardless of strategic quality. Measure against the metrics that actually matter. Compare opportunity conversion rates for AI-scored accounts against unscored ones. Track organic traffic growth from content built on a real narrative foundation, and sales cycle length for AI-prioritized accounts.

Step 7: Expand One Function at a Time, Compounding as You Go

Once one workflow is genuinely embedded, connected to clean data and a real strategic foundation, expand to the next function. Feed its output back into the ones already running. This is how you move from Stage 1 to Stage 3 on the maturity model above: one deliberate, measured expansion at a time, not a simultaneous tool-buying spree.

FAQs

What does AI in B2B marketing actually mean?

It means using machine learning and generative AI to analyze account and buyer data, generate content and campaign variations, and make real-time targeting decisions. The best results come when it sits inside an existing GTM strategy rather than running as a standalone initiative.

Is AI replacing B2B marketers?

No. Adoption data consistently shows AI improving execution speed and content volume, not replacing strategic decision-making. Teams that treat AI outputs as decisions to be reviewed, not decisions already made, get the best results.

What’s the difference between AI marketing and AI-integrated marketing?

AI marketing often means point tools used in isolation — a writing assistant here, a scoring tool there. AI-integrated marketing means those tools draw from the same ICP data and narrative foundation and feed each other, compounding in effectiveness rather than operating as disconnected experiments.

Why does AI-generated content sound generic?

Because most teams prompt AI models with no specific brand or customer context, so the output defaults to the statistical average of everything else written on the topic. The fix is building a structured narrative foundation — real customer language, positioning, and proof points — before generating anything, then editing for specificity, not just grammar.

What should I fix before investing in AI marketing tools?

Your ICP definition, your CRM data quality, and your core narrative/positioning. AI tools amplify whatever foundation is underneath them — a weak ICP or messy data produces confidently wrong output at scale, which is worse than no automation at all.

Which AI tools should a B2B marketing team start with?

Start with the function where your data is already clean and your foundation is built. That’s usually content generation or lead scoring. Avoid buying tools across every function at once. Evaluate any tool on whether it can ingest your own brand and customer context, not just its feature list.

How do I measure whether AI is actually working in my marketing?

Track pipeline-level outcomes. Compare opportunity conversion rates for AI-scored versus unscored accounts, and watch AI Overview citations for narrative-founded content. Sales cycle length for AI-prioritized targets tells you more than content volume or emails sent.

Will AI content ranking hurt my SEO?

Generic AI content is increasingly indistinguishable from every other site’s generic AI content, which makes genuinely specific, well-sourced content more valuable, not less. Content built on a real narrative foundation performs well in traditional search and in AI Overview citations. Content generated from bare prompts blends into the noise.


AI in B2B marketing isn’t a separate strategy from your GTM plan — it’s an execution layer on top of one. The teams pulling ahead right now aren’t the ones with the most AI tools. They’re the ones who fixed their ICP and TAM foundation first, built a real narrative to feed the models, and embedded AI inside a GTM system that was already sound. Everything else is just faster execution of whatever strategy — good or bad — was already underneath it.
We Built Our Website in 4 Days With AI: Here’s How (with Instructions)

B2B marketing agencies, though often experts, are notorious for incoherent websites. Not without good reason! A good agency stays on their toes, and pivots services as the market demands, but without internal brand alignment, the website can quickly fall out of date.

We fell victim.

Our (lovely) website read like a brochure and its positioning was inaccurate given the evolution of our services. It was time for a change, we decided to make it a challenge: to build a website in four days using AI.

Why to Build a Website with AI

We (The CEO and CMO of StepUp) gave ourselves a max subscription to Claude and a one-week deadline. The CEO lives and breathes the service offer and audience alignment, and the CMO holds the reins on messaging and brand delivery.

The website you’re on is the result.

This isn’t a dev blog post about how satisfying it felt to watch an AI write CSS. You can find plenty of those. This is what happened when a B2B marketing agency — the kind of company that writes GTM strategy for other companies for a living — turned the same rigor inward: the audit, the ICP thinking, the redirect math, the actual before-and-after numbers, and the parts where the AI did something we didn’t expect (in both directions). If you run marketing at a B2B company and you’re wondering whether “rebuild the site in days, not quarters, using AI” is a real option or a LinkedIn flex, we say “yes” – and this is the long answer.

We’ll walk through why the old site had to go, why we picked Claude Code over the four other paths available to us, the hour-by-hour build across four days, where the AI surprised us (and annoyed us), what changed in the 30 days since launch, and — because we’re a marketing agency and not just a group of people who like typing into a terminal (really, we do not) — a reusable framework you can take into your own rebuild, whether or not you touch a line of code yourself.

The Problem: The Old Site Didn’t Clarify Our Positioning

AKA: Practice What You Preach

We’re a bunch of highly qualified former-execs who work as fullstack execution partners delivering boutique services, that wasn’t coming across clearly enough on our site. Nor was the site conveying the ways we’ve integrated AI into our services (think “native” but without the hyperbole).

Our messaging was fine — but we needed some fixes:

  • It was slow to change. Updating a page meant filing a request, waiting for a dev window, and hoping nothing broke. For an agency whose entire value proposition is speed of execution, that’s not some minor inconsistency.
  • It didn’t reflect where the actual demand was moving. In a keyword-gap review we ran against a competitor — an agency we admire and feel is doing real work in industrial and medtech marketing — we found we already had organic footholds in industrial lead generation and industrial marketing topics. Traffic was showing up. There was no page for it to land on. We were ranking for a business we hadn’t built a front door for.
  • It looked like every other B2B agency site. Hero section, three-icon feature grid, logo wall, generic CTA. If you removed our name from the top, you could not tell our site apart from our cohort by scrolling it. That’s fine if you’re selling commodity services. It’s a liability if your entire differentiator is that you’re not doing what everyone else does.

The Numbers

We pulled our own domain data the way we’d pull a prospective client’s,

None of the numbers were catastrophic on their own. We rank on over 290 keywords, we have some solid pillars, we show up. So that’s good news. But there’s e gap between what the numbers showed and our conversions, and so we needed to rethink our content strategy and get more aggressive about AEO and relevance on offer.

The Urgency

The forcing function wasn’t a redesign itch. It was a strategy review where we mapped our own keyword clusters the way we’d map a client’s, and then we laid the clusters against the actual site structure and there wasn’t one. Content existed. Architecture didn’t. A prospective client searching “industrial b2b marketing” who found their way to us would land on a blog post with no next step, no proof we understood their world, and no path into a conversation.

At that point, rebuilding wasn’t a nice-to-have design refresh. It was the fastest way to close the gap between what we tell people in sales calls and what a stranger finds when they Google us at 11pm before a Monday pitch meeting. We gave ourselves four days because that’s roughly how long we’d give a client before we’d call a GTM plan “stale” — if we couldn’t hold ourselves to the same clock, the positioning was hollow.

Why Claude Code (and Why We Kept WordPress)

What we ruled out

We looked at four paths before picking one.

Hire a dev agency for a proper rebuild. This is the default path, and it’s the one every competitor case study we read (chandlernguyen’s blog rebuild, StackOne’s Astro/Cloudflare migration, the dev.to Astro rewrite) implicitly argues against just by existing — they all did it themselves, faster than an agency engagement would move. A typical scoped website rebuild runs 8–12 weeks from kickoff to launch once you account for discovery, design rounds, dev sprints, and QA. We didn’t have a content or budget problem with that path. We had a credibility problem: an agency that sells “we move fast” cannot, in good conscience, take a full quarter to prove it on its own site.

Use an AI website builder (v0, Framer AI, similar tools). These are genuinely good for a from-scratch marketing page. They’re much weaker at working inside an existing, indexed, ranking site where redirect integrity and content preservation matter as much as the new pages you’re adding. We didn’t want a new site. We wanted our site, done right, without losing the 284 keywords we’d already earned.

Rebuild it ourselves manually, the old way. Someone opens the theme files, someone else writes copy in a Google Doc, someone hands off to a developer who’s also doing three other things this week. This is how the old site got the way it was in the first place. Repeating the process just gets you a nicer-looking version of the same problem in another 18 months.

The Option We Chose

Use Claude Code as the primary build tool, with a human — us — directing every decision. This is what we did, and the reason wasn’t novelty. It’s that Claude Code can hold the entire codebase in context, make multi-file changes without losing track of what it changed and why, run and check its own output, and do it at the speed of a conversation instead of the speed of a ticket queue. For a four-day timeline, that’s the only version of “fast” that also holds up to QA.

What “AI-integrated marketing” actually means when it’s not a slide

We use that phrase in pitch decks, so it felt important to actually test it on something with our name on it. AI-integrated, for us, doesn’t mean “we used ChatGPT to write blog outlines.” It means the tool is embedded in the actual production workflow, not bolted onto the front end of it. Claude Code wasn’t drafting website copy for a human to paste in later — it was reading our existing template files, understanding our WordPress theme structure, writing the PHP and CSS itself, running local checks, and flagging what it wasn’t sure about. The best evidence we could offer a prospective client that “AI-integrated marketing” is a real capability and not a buzzword was to point at our own site and say: this is what the workflow produced, in four days, and here’s exactly how.

The Stack We Landed On

Here’s where we differ from every competitor piece we read in researching this: we didn’t move off WordPress. StackOne’s team rebuilt on Astro and Cloudflare. The dev.to case study rebuilt on Astro too. Both are excellent technical write-ups if you’re choosing a stack from zero. We weren’t choosing from zero — we had a marketing team that publishes blog posts and landing pages weekly without needing a deploy, HubSpot forms wired into a CRM that our sales team actually uses, and no appetite to trade “our marketing team can ship a landing page on a Tuesday” for “technically superior, but now every content change is a pull request.”

So the brief we gave Claude Code was narrower and, we think, harder: rebuild the theme layer from the inside. Custom block templates, a real design system, faster page weight, clean schema markup — all inside WordPress, all without breaking the publishing workflow non-technical people on our team rely on every week. If your organization runs on a CMS your marketing team actually uses, this is probably the more honest version of “rebuild the site fast” than ripping the whole platform out and rebuilding on a JS framework, however satisfying that migration is to write up afterward.

The Day-by-Day Build

Day 0: The Brain File

We didn’t start Day 1 by opening a code editor. We started by writing the same kind of narrative document we make every client sit through before we touch their content: a single file capturing our ICP, our positioning against the market, our tone of voice, our non-negotiables, and the page inventory we needed. Internally we call this a brain file — it’s the same practice we use for client onboarding, just pointed at ourselves for the first time.

That file became the system prompt context Claude Code worked from for all four days. It included:

  • Our actual ICP: VP Marketing and CMO-level buyers at B2B companies, plus a newly scoped secondary ICP of industrial and medtech manufacturers looking for an AI-capable marketing partner they can actually afford
  • Our positioning wedge: full-stack execution, not advisory-only, with AI genuinely embedded in delivery
  • Voice rules: direct, no filler, no “in today’s fast-paced digital landscape” openers
  • The full list of existing ranking URLs and their current positions, flagged as untouchable without a redirect plan
  • The new page inventory we wanted to exist by Day 4

This single-file discipline mattered more than any code change we made. Every time Claude Code proposed a new component or a page structure, it had this file to check itself against, and so did we. Skipping this step is, in our experience, the single biggest reason AI-assisted rebuilds turn into generic-looking sites — the model defaults to a template unless you hand it a real point of view to build from.

Day 1: Audit, Architecture, and the Redirect Map

Morning. We had Claude Code crawl the existing site structure and cross-reference it against our exported organic keyword data — all 284 ranking keywords, with position, URL, and search volume attached. The goal was a single spreadsheet-equivalent (we kept it as a structured markdown table Claude Code could reference in later sessions) mapping every existing URL to its fate: keep as-is, keep with a new template, merge into a pillar page, or redirect.

This is the step every AI-rebuild article we read glossed over or skipped entirely, and it’s the one that actually protects your SEO equity during a fast rebuild. We were not willing to trade our TAM guide’s position-30 ranking on a 33,100-volume keyword for a prettier page. So the rule was explicit: no URL that currently ranks moves or changes without a mapped, tested redirect, and no ranking page’s core content gets rewritten from scratch — it gets refined in place.

By early afternoon we had:

  • A full URL inventory (roughly 60 indexed pages)
  • A redirect map for the handful of URLs that genuinely needed to consolidate
  • A confirmed “do not touch the URL, refine the content” list for the TAM guide, the ICP meaning post, the inbound-vs-content-marketing post, and the go-to-market plan post — our four strongest existing assets

Day 1, Afternoon: Scaffolding the Theme

Afternoon. With the architecture decided, we had Claude Code scaffold the new theme structure inside WordPress: a fresh set of custom block templates, a component library folder, and a local development environment mirroring production so nothing we built touched the live site until Day 4. This is also when we defined the new page types the brain file called for but the old site didn’t have: a proper services architecture reflecting GTM execution (not just “marketing services”), a case study template, and pillar pages for our AI-Integrated Marketing hub.

Day 1 total: roughly 60 pages audited, a redirect map covering every URL change, and a scaffolded theme ready for design work. No design decisions yet — that was intentional. We didn’t want visual polish distracting from the architecture being right first.

Day 2: The Design System and the Pages That Didn’t Exist Yet

Day 2 was almost entirely about building a real design system instead of a page-by-page patchwork, because a design system is what lets you build new page types in hours instead of days for the rest of the project’s life, not just this week.

We gave Claude Code direction on visual tone (the brand color palette, type scale, and a small set of reference screenshots from sites whose density and confidence we liked — not to copy, but to calibrate against) and had it build out:

  • A header/footer/navigation system that could flex for both the core site and the new industrial/medtech sub-section without looking bolted on
  • A modular CTA block system, because our old site had six different visual treatments for “book a call” and none of them matched
  • A pillar-page template built specifically to support long-form content like the TAM guide and the GTM strategy post — with a sticky table of contents, internal cross-linking slots, and FAQ schema built in from the template level, not added post hoc
  • A case study template, which we didn’t have at all before this rebuild — a gap that mattered given our positioning is proof-of-execution, not just claims of it
  • The Industrial & MedTech AI-Integrated Marketing hub template — distinct enough to speak to a manufacturing buyer’s actual concerns (lead generation, engineers in the buying committee, long sales cycles) without feeling like a separate microsite

Where We Overrode the First Pass

This is the day the human-in-the-loop model mattered most. Claude Code’s first pass at the hero section for the homepage was clean, fast, and completely generic — competent SaaS-template energy, the same three-line headline plus subhead plus button pattern you’d find on five hundred other B2B sites. We rejected it twice and rewrote the direction ourselves: shorter headline, no stock-photo hero image, lead with a specific claim instead of a category statement. The third pass, once we’d given it a sharper brief instead of “make it better,” landed. Design taste is still a place where a human has to hold the line — the AI will happily ship “fine” all day if you let it.

By the end of Day 2 we had a working component library and every template the new architecture needed, still on the local dev environment, still untouched by anything live.

Day 3: Content Migration and the Industrial/MedTech Hub

This was the longest day, and the one where the “AI-integrated marketing” claim either held up or didn’t, because it’s where content and code had to work together instead of in sequence.

Content migration. Every one of the “do not touch the URL” pages from Day 1 got a content refresh — not a rewrite, a refresh. The TAM guide got updated data references, sharper internal links to the new ICP and GTM pillar pages, and FAQ schema pulled from the new template. The ICP meaning post got the same treatment, with added coverage of business ICP meaning and ICP sales meaning subtopics that search intent data showed we were leaving on the table. None of these pages lost their existing URL, and we spot-checked every one against its pre-rebuild cached version to confirm the core ranking content was intact, not diluted.

New Pages and Systems Integration

New pages. This is where the industrial/medtech opportunity became real instead of theoretical. We built out:

  • A dedicated Industrial B2B & MedTech AI-Integrated Marketing hub page, directly addressing manufacturers and medtech companies looking for a marketing partner that actually understands AI-integrated execution — not the generic “digital transformation” language most industrial agencies use
  • Supporting pages under that hub for industrial lead generation and AI marketing for manufacturers, tying back to content that was already ranking without a home
  • A GTM strategy pillar page consolidating our go-to-market content, with clear subsections addressing the key elements of a b2b go-to-market plan — a term we were already ranking for at position 61 with zero supporting architecture around it

Systems integration. Forms across every new page were wired back into HubSpot, matching our existing CRM lead-routing so nothing about the backend sales workflow changed even though every front-end template did. Claude Code handled the form markup and the HubSpot embed configuration directly, which meant no separate ticket to a martech admin to get forms live before launch.

By the end of Day 3, every planned page existed, populated, and internally linked. What remained was making sure none of it broke anything on the way out the door.

Day 4: QA, Launch, and Turning Search Console Back On

Morning: redirect and regression testing. We ran every one of the 284 tracked keywords’ URLs through the redirect map to confirm each resolved correctly — no redirect chains, no accidental 404s, no URL that used to rank now pointing at a generic homepage. This is tedious, and it’s exactly the kind of task Claude Code is good at doing exhaustively without getting bored on keyword 200 the way a human QA pass tends to. It wrote its own test script to walk the full URL list and flag anything that didn’t return the expected status code — we didn’t ask for that, it proposed it once it understood the scope of the check, and it caught two redirect targets we’d mistyped in the Day 1 spreadsheet.

Midday: performance and mobile QA. Page weight, Core Web Vitals, and mobile rendering across the new templates. The pillar-page template’s sticky table of contents broke on smaller viewports in the first pass — a real bug, not a taste issue — and got fixed in about twenty minutes once flagged.

Day 4, Afternoon: Search Console and Go-Live

Afternoon: the Search Console fix. Somewhere in the middle of pre-launch QA, we finally reconnected Google Search Console — a property that had been sitting disconnected for weeks, which meant our own dashboard had a blank space where “actual organic click data” should have been. There’s no elegant way to say this: the fastest way to fix a broken internal reporting gap turned out to be forcing ourselves into a hard launch deadline. We’re not proud of how long it sat broken. We are glad the rebuild made ignoring it impossible.

Evening: go-live. DNS and caching flushed, redirect map pushed live, new pages published, forms tested end to end with real HubSpot submissions, and a rollback snapshot kept on hand in case anything broke that QA hadn’t caught. Nothing did. Site was live by early evening on Day 4.

Four days, start to finish: architecture and audit on Day 1, design system and new templates on Day 2, content migration and new page builds on Day 3, QA and launch on Day 4. No day was “easy” — Day 3 ran long, Day 4’s redirect testing was more tedious than anyone expected — but none of it required waiting on anyone outside the room.

Unexpected Moments

Where Claude Code did more than we asked

The redirect test script on Day 4 is the clearest example — we asked for a spot-check, it built an exhaustive one and used it to catch its own earlier mistakes. Two other places it went further than the brief:

  • Schema markup we didn’t explicitly request everywhere. Once we asked for FAQ schema on the pillar-page template, Claude Code proposed (and we approved) extending Organization and Article schema consistently across every new page type, not just the ones we’d specified, because it recognized the pattern from the first request and applied it site-wide.
  • Orphaned page detection. During the Day 1 audit, it flagged three old blog posts that had no inbound internal links anywhere on the site — pages that existed, indexed, with real search volume, that nothing pointed to. We hadn’t asked it to look for orphans specifically; it surfaced them as part of building the URL inventory because the pattern was visible in the data.

Where we had to pull rank

The generic hero section on Day 2 is one example. Two others stand out:

  • Over-engineering the CTA block system. Left alone, Claude Code’s first draft of the reusable CTA component supported about a dozen configurable variants — background style, icon position, button count, layout direction. Technically impressive, practically a maintenance problem for a marketing team that needs to drop a CTA into a blog post without opening a settings panel with twelve options. We cut it down to three variants and it complied immediately once we explained the audience wasn’t a developer.
  • A stat that needed fact-checking. In drafting supporting copy for the GTM pillar page, a cited industry statistic didn’t match what we could verify against our own sourced data. We caught it in review, asked for the source, and when it couldn’t produce one that held up, we cut the line rather than keep an unverifiable number on a page with our name on it. This is the same standard we hold client content to, and it’s worth stating plainly: the tool will produce plausible-sounding claims, and a human still has to be the one who decides what’s true enough to publish.

The near-miss

The closest call was on Day 4. One of our highest-value redirects — the old URL for our go-to-market plan content — had been mapped to consolidate into the new GTM pillar page. The redirect worked. What we almost missed was that the old page had picked up a handful of external backlinks over the past year that we hadn’t audited for anchor text context. Had we redirected without checking, those links would have pointed at a page whose framing didn’t quite match the anchor text they’d been built around, which can quietly cost you the SEO value the backlink was providing in the first place. We caught it because the redirect test script’s output included the destination URL next to each source, and something about the pairing looked off on a second read. We adjusted the pillar page’s opening section to better match the context those backlinks expected before finalizing the launch. Small fix, but it’s the kind of thing that only surfaces if a human is actually reading the QA output instead of just checking for a green checkmark.

The Numbers: What Changed

Before / after

The comparison that matters most to us in a transfer is the redirect integrity number. Zero of our 284 ranking keywords lost their page or dropped into a redirect chain during the fastest rebuild we’ve ever run. That’s the number that tells you whether “fast” and “reckless” are the same thing here. They weren’t.

30 days post-launch

  • No ranking drop on the four protected pillar pages (TAM guide, ICP meaning, inbound vs. content marketing, GTM plan) — all four held their pre-launch positions within normal week-to-week variance, confirming the “refine, don’t rewrite” rule did its job.
  • New Industrial & MedTech hub page indexed within days and began pulling early impressions on industrial lead generation and ai marketing for manufacturers terms — too early to call a ranking win, but the page now exists to catch the traffic that was previously landing on orphaned blog content with no next step.
  • Time-to-publish for a new landing page dropped from “plan and wait” to same-day, which is the operational change that actually matters long after this rebuild is old news — our marketing team can now ship a new page type without a developer in the loop, because the design system Claude Code built is something our own content team can extend inside WordPress using the existing block templates.
  • Case study template usage: three client case studies published in the 30 days since launch, versus zero in the prior quarter, simply because a template now exists and publishing one doesn’t require custom design work each time.

We’re not going to pretend a 4-day rebuild produced a hockey-stick traffic chart in 30 days — that’s not how organic works, and anyone claiming otherwise in a case study like this is selling you something (which is fine, but, you know). What changed measurably and immediately is publishing velocity, SEO equity retention, and having an actual front door for a market we were already earning traffic from.

The 4-Day Framework You Can Steal

If you’re a marketing leader weighing whether this is a real option for your own site — here’s the framework, mapped explicitly to GTM discipline rather than dev-team logistics, because that’s the lens that determines whether it works.

Day 1 — Lock the narrative before you touch a template.

  • Write the brain file first: ICP, positioning wedge, voice rules, non-negotiables. If you can’t write this in a page, you’re not ready to rebuild — you’re ready to workshop. (We run this workshop)
  • Audit every existing ranking URL and its position/volume. Nothing gets touched without a documented reason.
  • Build the redirect map before the design system exists. Architecture decisions should follow the narrative and the SEO equity you’re protecting, not the other way around.

Day 2 — Design system reflects the narrative, not a template library.

  • Build components, not pages — CTA blocks, headers, pillar templates, case study templates, whatever your new architecture calls for.
  • Expect the AI’s first pass to default to generic. Reject it explicitly and give sharper direction rather than vague “make it better” feedback.
  • Resist over-engineering. If a non-technical person on your team can’t use the component without a settings manual, simplify it before it ships.

Framework Days 3 and 4

Day 3 — Migrate protectively, build expansively.

  • Refresh, don’t rewrite, anything that currently ranks. Preserve the URL, sharpen the content, add internal links to new pages.
  • Build the new pages your keyword and ICP data says you’re missing — the gap between what you rank for and what you have a page for is usually sitting in your own analytics already.
  • Wire systems (CRM, forms, tracking) as you build, not as a separate step afterward.

Day 4 — Launch is a GTM event, not a deploy.

  • Test redirects exhaustively — every tracked keyword’s URL, not a sample.
  • QA against business goals, not just visual bugs: does every page have a next step, does every form route correctly, is analytics actually connected before go-live (not after).
  • Keep a rollback plan on hand and use the launch deadline to fix the internal reporting gaps you’ve been ignoring — you’ll finally have a reason to.

Steal this framework directly. The specific tool matters less than the discipline: narrative before architecture, protection before expansion, and treating launch day as a business event with a checklist, not a code deploy with a party.

Should You Do This Yourself? Answering the Objections

“Isn’t this risky without a development team?” We had development judgment in the room the entire time — ours. Claude Code didn’t replace the need for someone who understands code, redirects, and SEO risk. It replaced the waiting: the ticket queue, the sprint planning, the calendar coordination across a dev agency’s other clients. If you don’t have anyone on your team who can read a redirect map and catch a broken template, that gap doesn’t disappear because the tool is capable — you still need a human who can tell good output from confident-sounding bad output.

“What about code quality and long-term maintainability?” This is a fair concern with any fast build, AI-assisted or not. Our answer was structural: we built inside WordPress specifically so our non-technical marketing team can maintain and extend the site without touching the underlying template code, and we kept the component system deliberately simple (three CTA variants, not twelve) so future changes don’t require re-learning a complex system. Speed at launch doesn’t help you if the thing you shipped can only be touched by the same tool that built it.

Rankings and the Four-Day Clock

“Won’t you lose search rankings moving that fast?” Only if you skip the audit step to save time, which is the one place we refused to move fast. The redirect map and protected-URL list took longer than any other single task on Day 1, and it’s the reason we launched with zero ranking pages lost. Speed on execution and rigor on protection aren’t in tension — the rigor is what makes the speed safe.

“Isn’t four days just a marketing claim?” It’s a real clock, but it’s a clock that only closes because the narrative work — the brain file, the ICP clarity, the positioning decisions — happened before Day 1 started, not during it. If you walk into this without your GTM story already sharp, you’ll spend your four days figuring out who you are instead of building the site that says it. The build was fast because the thinking wasn’t rushed.

What This Means If You Run B2B Marketing

The honest takeaway isn’t “AI can build your website in four days,” even though that’s technically what happened here. It’s that the constraint most B2B marketing teams treat as fixed — website changes are slow, expensive, and gated by a dev team’s calendar — isn’t actually fixed anymore, if you’re willing to put the same GTM discipline into your own site that you’d put into a client’s. AI-integrated marketing, done properly, isn’t a content-generation shortcut. It’s a way to close the gap between what your positioning claims and what a stranger finds when they search for you, on a timeline that matches how fast your market actually moves.

We rebuilt our site in four days because our own positioning demanded we prove speed was real, not aspirational. If you’re weighing whether your site says the same thing your sales team says on a call — and whether you could close that gap in days instead of a quarter — that’s a conversation we’re set up to have, because we just had it about ourselves first.

AI Marketing for Manufacturers: The 2026 Playbook for Industrial B2B

Manufacturing marketing has a problem — and it’s not the one you think.

You’re not struggling because your products are too complex to market. You’re struggling because your marketing still operates like it’s 2018: generic email blasts to purchased lists, trade show booths that cost $40K and generate a spreadsheet of badge scans, and a website that reads like a spec sheet nobody asked for.

Meanwhile, your buyers changed. The average B2B manufacturing purchase now involves 6–10 decision-makers. Seventy percent of the buying journey happens before a prospect ever talks to your sales team. And the engineers, plant managers, and procurement leads evaluating your solutions are doing their research at 11 PM on their phones — not waiting for your rep to call back on Monday.

AI marketing for manufacturers isn’t a buzzword. In fact, it’s the operational shift that closes the gap between how you sell and how your buyers actually buy.

At StepUp, we run full marketing operations for global B2B manufacturers — the kind of companies where one AI-powered marketing department replaces what used to require a team of eight. This guide is the playbook we use with our industrial clients, stripped of vendor bias, built for mid-market manufacturers who need results without a six-figure martech budget.

Here’s what we’ll cover — and more importantly, what you can actually implement.

Why AI Marketing Matters for Manufacturers (The Shifting B2B Buyer Landscape)

Manufacturing has been slower to adopt AI-driven marketing than SaaS or fintech. Indeed, there are legitimate reasons: longer sales cycles, highly technical products, smaller addressable audiences, and a culture that (rightly) values engineering rigor over marketing flash. Most of these are structural, not attitudinal — we broke them down in our guide to the unique challenges of industrial marketing.

But those same characteristics are exactly why AI marketing for manufacturers is transformative — not despite the complexity, but because of it.

The Three Shifts You Can’t Ignore

Shift 1: The self-educated buyer is now the norm. Gartner’s research consistently shows that B2B buyers spend only 17% of their purchase journey meeting with potential suppliers. For manufacturers selling capital equipment, specialty materials, or industrial components, this means your buyers are forming opinions — and shortlists — long before your sales team knows they exist.

AI changes this equation. Instead of guessing which content to create and hoping it reaches the right person, AI-driven systems analyze actual buyer behavior patterns — what pages they visit, what content they download, what questions they search for — and surface the right asset at the right moment.

Shift 2: The buying committee is larger and more fragmented. A $500K industrial equipment purchase doesn’t get approved by one person — the buying committee decides together. You’re selling to the plant engineer who cares about throughput specs, the operations VP who cares about uptime, the CFO who cares about total cost of ownership, and the procurement manager who cares about compliance documentation.

Traditional marketing treats them all the same. The engineers in that committee are usually your best internal advocates, too, which is why we argue engineers belong in sales and marketing. AI-powered personalization lets you speak to each stakeholder’s specific concerns — automatically, at scale, without creating 47 different email sequences by hand.

Shift 3: Your competitors are already moving. The SERP you’re reading this from is proof. Two years ago, “AI marketing for manufacturers” barely registered search volume. Now it’s contested territory. The manufacturers who build their AI marketing infrastructure in 2026 will compound that advantage over the next decade. The ones who wait will spend 3x as much catching up.

Why Manufacturing Is Actually Ideal for AI Marketing

Here’s what most guides get wrong, though: they treat manufacturing as a laggard that needs to “catch up” to B2B SaaS marketing practices. That framing misses the point entirely.

Manufacturing marketing has characteristics that make AI more effective, not less:

  • Rich product data. You have spec sheets, CAD files, performance data, compliance certifications, and application guides. Naturally, AI thrives on structured data — and manufacturers have more of it than any SaaS company.
  • Defined buyer personas. Notably, your customers aren’t abstract. They’re mechanical engineers at automotive OEMs, maintenance managers at food processing plants, or procurement directors at aerospace contractors. Narrow targeting is where AI delivers the highest ROI.
  • Long sales cycles with multiple touchpoints. A 6–18 month sales cycle generates enormous amounts of behavioral data. Moreover, AI models get better with more data points per deal — your long cycle is an asset, not a liability.
  • High customer lifetime value. When a single closed deal is worth $200K–$2M+, even marginal improvements in lead quality or conversion rate translate to massive revenue impact.

How Manufacturers Use AI Marketing: Predictive Analytics, Personalization, and Lead Scoring

So let’s move past the theory and into what AI marketing for manufacturers actually looks like inside a real marketing stack. We’ll organize this by the three capabilities that deliver the most measurable impact for our industrial clients.

Predictive Analytics: Know What’s Coming Before Your Competitors Do

Predictive analytics in manufacturing marketing means using historical data — your CRM records, website analytics, industry data, and market signals — to forecast which accounts are most likely to buy, when they’ll buy, and what they’ll need.

Practical applications:

  • Demand forecasting by segment. Instead of running the same campaign to your entire database, AI models can identify which industry verticals or geographic regions are showing early buying signals. One of our clients — a precision components manufacturer — used predictive models to identify a surge in quoting activity from EV battery manufacturers six weeks before it showed up in their pipeline. They redirected ad spend and created targeted content for that segment, capturing 3x their normal lead volume from the automotive vertical that quarter.
  • Content performance prediction. AI tools analyze which topics, formats, and distribution channels historically drive the most qualified traffic for your specific audience. This means you stop guessing whether that technical whitepaper on corrosion resistance will outperform the ROI calculator — the data tells you before you invest the production time.
  • Churn and expansion signals. For manufacturers with recurring revenue (consumables, service contracts, replacement parts), predictive models can flag accounts showing early disengagement signals — reduced portal logins, declining order frequency, support ticket patterns — so your team intervenes before you lose the account.

Personalization at Scale: Speaking to Every Stakeholder Without a 50-Person Marketing Team

This is where AI delivers the most visible impact in manufacturing marketing, especially for lean teams. The challenge has always been: how do you create personalized experiences for a buying committee of 6–10 people across dozens of active opportunities, when your marketing team is three people (or one)?

What AI-driven personalization looks like in practice:

  • Dynamic website content. When a returning visitor from an aerospace company lands on your homepage, AI can surface case studies from aerospace clients, relevant certifications (AS9100, NADCAP), and content tailored to aerospace applications — automatically. A visitor from food & beverage sees FDA compliance documentation, washdown-rated product lines, and food-safe material specs. Same website, different experience, zero manual intervention.
  • Adaptive email sequences. Instead of a static 8-email nurture sequence, AI-driven systems adjust the next email based on what the recipient actually engaged with. Downloaded a spec sheet? Next email features an application guide for that product line. Watched a facility tour video? Next touch is an invitation to a virtual demo. This isn’t theoretical — platforms like HubSpot (which we implement for our manufacturing clients) now have native AI features that enable this without custom development.
  • Account-based personalization. For your top 50 target accounts, AI can monitor company news, job postings, regulatory filings, and social signals to trigger personalized outreach. If a target account posts a job for a “process improvement engineer,” that’s a buying signal for your automation or efficiency-related products — and AI catches it at 2 AM so your sales team has a warm conversation starter by 8 AM.

AI-Powered Lead Scoring for Manufacturers: Stop Wasting Sales Time on Unqualified Leads

The #1 complaint we hear from manufacturing sales teams: “Marketing sends us leads, but they’re not ready to buy.” Traditional lead scoring assigns points based on arbitrary rules — downloaded a whitepaper (+10), visited the pricing page (+20), has a VP title (+15). The problem: those rules reflect what marketing thinks matters, not what actually predicts a closed deal.

How AI lead scoring works differently:

AI models analyze your historical closed-won deals (and closed-lost ones) to identify the behavioral patterns that actually correlate with purchase. Often, the signals are surprising:

  • A prospect who visits your technical documentation three times in a week may be a stronger signal than one who downloads a top-of-funnel guide
  • Engagement from multiple people at the same company within a 30-day window is often the single strongest predictor of deal progression
  • Time-on-page on your applications or industries pages frequently outweighs form fills as a quality indicator

Implementation note: You don’t need a custom machine learning model. HubSpot’s predictive lead scoring, Salesforce Einstein, and tools like 6sense or Demandbase offer manufacturing-applicable models out of the box. Still, the key is feeding them clean historical data — which means your CRM hygiene matters more than your AI budget. It also means agreeing with sales on what a qualified lead actually is — the same MQL-to-SQL handoff problem in a different costume.

AI Marketing for Long Manufacturing Sales Cycles and Complex Buying Committees

This is the section most “AI marketing” guides skip — because their authors come from SaaS, where a sales cycle is 30 days and one person swipes a credit card. Manufacturing doesn’t work that way, and your AI marketing strategy shouldn’t pretend otherwise. Generally, the longer the cycle, the more the system has to carry.

Mapping the Manufacturing Buying Journey with AI

A typical capital equipment purchase moves through five stages, each involving different stakeholders:

StageDurationKey StakeholdersAI Application
Problem Recognition1–3 monthsEngineers, operatorsIntent data monitoring, SEO-driven content
Solution Research2–4 monthsEngineers, managersPersonalized content delivery, chatbot qualification
Vendor Evaluation2–3 monthsProcurement, engineering, financeDynamic case studies, ROI calculators, competitive positioning
Consensus Building1–3 monthsFull buying committeeMulti-stakeholder nurture, account-based signals
Purchase Decision1–2 monthsC-suite, procurementProposal personalization, deal risk scoring

Still, AI doesn’t shorten the cycle by magic — it eliminates the dead time between stages and ensures you’re engaging every stakeholder with relevant content at each phase.

Multi-Threading Buying Committees Automatically

The biggest deal killer in manufacturing sales isn’t competition — it’s internal consensus failure. A champion at the prospect company loves your solution, but they can’t get the CFO, the operations VP, and procurement aligned.

AI helps here in a way that manual marketing simply can’t:

1. Contact discovery and mapping. AI tools (LinkedIn Sales Navigator’s AI features, ZoomInfo, Apollo) can identify all likely buying committee members at a target account based on title patterns, organizational structure data, and engagement signals. When one engineer from Acme Manufacturing downloads your thermal management whitepaper, AI flags the five other people at Acme who should also be in your nurture.

2. Stakeholder-specific content routing. Once you’ve identified the committee, AI enables automated content streams tailored to each role:

  • The engineer gets technical specs, application notes, and performance comparisons
  • The operations VP gets uptime data, implementation timelines, and change management resources
  • The CFO gets TCO analyses, financing options, and ROI projections
  • Procurement gets compliance documentation, supplier qualification packages, and reference customer contacts

3. Deal velocity monitoring. AI models track engagement velocity across the entire buying committee. If the engineer is highly engaged but the CFO has gone silent, the system alerts your sales team to the stall — and suggests CFO-specific content to re-engage that stakeholder. This kind of multi-threaded intelligence used to require a dedicated sales ops analyst. Now it runs in the background.

AI-Powered Trade Show and Event Marketing for Manufacturers

Trade shows remain the single largest line item in most manufacturing marketing budgets — and the least optimized. The typical manufacturer spends $30K–$80K per event on booth space, travel, collateral, and logistics, then walks away with a box of badge scans and no clear way to measure trade show ROI. AI marketing for manufacturers changes this equation at every stage of the event lifecycle.

Pre-Show: AI-Driven Targeting and Outreach

Instead of blasting your entire database with a “visit us at booth #1247” email, AI enables precision pre-show targeting:

  • Attendee intent matching. Cross-reference the published attendee or exhibitor list with your intent data and CRM. AI identifies which registered attendees are already researching solutions you sell — these get priority outreach with personalized meeting requests, not generic booth invitations.
  • Predictive meeting scheduling. AI analyzes historical trade show data (which meetings converted to pipeline in past events) to recommend which prospects your sales team should prioritize for on-site meetings. A 30-minute conversation with a pre-qualified prospect is worth more than 200 badge scans.
  • Personalized pre-show content. AI generates role-specific pre-show emails: the engineer gets a preview of the new product demo, the procurement lead gets a meeting link with your compliance team, the VP gets an executive briefing invitation.

At the Show: Real-Time Lead Qualification

  • Live lead scoring. When a visitor scans their badge at your booth, AI instantly enriches their profile — company size, role, intent signals, previous engagement with your content — and serves your booth team a real-time brief. Your reps know in seconds whether they’re talking to a decision-maker from a target account or a student collecting swag.
  • Dynamic follow-up tagging. Instead of dumping all badge scans into one list, AI categorizes booth visitors by engagement depth and buyer stage in real time. Hot leads get immediate sales follow-up; warm leads enter a nurture sequence; informational visitors get added to your newsletter.

Post-Show: Automated, Personalized Follow-Up

This is where most manufacturers lose the trade show investment, because the follow-up window closes fast. The typical post-show follow-up is a single generic email sent 5–10 days after the event — by which time your prospects have already heard from 40 other exhibitors.

By contrast, AI-powered post-show follow-up looks different:

  • Same-day personalized sequences. AI triggers role-specific follow-up emails within hours of the event, referencing the specific products or topics the visitor engaged with at your booth.
  • Multi-touch nurture. Instead of one email and done, AI enrolls trade show leads into targeted nurture sequences based on their qualification score and the buying stage signals captured at the booth.
  • Attribution and ROI measurement. AI connects trade show interactions to downstream pipeline — tracking which booth conversations influenced which deals, across a 6–18 month sales cycle. This gives you actual event ROI, not just a cost-per-badge-scan number.

When AI marketing for manufacturers is applied to trade shows, the same event budget generates 3–5x more qualified pipeline — not because you attracted more visitors, but because you identified, prioritized, and followed up with the right ones.

The AI Marketing Stack for Mid-Market Manufacturers (Vendor-Neutral Recommendations)

Here’s where we get practical — the same stack logic we apply to AI in B2B marketing generally, tuned for industrial buyers. Most guides either push a specific product or list 30 tools with no guidance on what actually matters. We’ll take a different approach: here’s the stack architecture that works for AI marketing for manufacturers, with tool categories and selection criteria.

Layer 1: Foundation — CRM + Marketing Automation

What you need: A unified platform that manages contacts, companies, deals, email marketing, landing pages, and basic analytics in one place.

Our recommendation: HubSpot Marketing Hub (Professional or Enterprise). We’re a HubSpot agency, so we’re transparent about that bias — but the reasoning stands independently. For mid-market manufacturers ($10M–$500M revenue), HubSpot offers the best balance of AI-native features, ease of adoption for small marketing teams, and integration depth with industrial-specific tools.

Alternatives: Salesforce Marketing Cloud (if you’re already on Salesforce CRM), Marketo (if you have dedicated marketing ops staff), or ActiveCampaign (budget option with surprisingly capable AI features).

Selection criteria that actually matter:

  • Native AI lead scoring (not a bolt-on)
  • ERP/product data integration capability (can it pull SKU data, pricing, inventory?)
  • Multi-language support (critical for manufacturers selling globally)
  • Ease of use for a 1–3 person marketing team (this disqualifies Marketo for most mid-market manufacturers)

Layer 2: Intelligence — Intent Data + Account Identification

What you need: Tools that tell you which companies are actively researching solutions you sell, even before they visit your website.

Tool category options — and see our wider round-up of AI marketing tools:

  • Visitor identification: Clearbit Reveal, Leadfeeder, or HubSpot’s built-in company identification
  • Third-party intent data: Bombora, G2 (less relevant for manufacturing), or TrustRadius
  • Account intelligence: 6sense, Demandbase, or ZoomInfo

The manufacturing-specific consideration: Most intent data platforms are calibrated for software buyers. For manufacturing, you need to validate that the intent taxonomy includes relevant topics — “CNC machining,” “industrial automation,” “supply chain resilience” — not just generic B2B categories. Ask vendors for their manufacturing-specific topic coverage before buying.

Layer 3: Content + SEO — AI-Assisted Creation and Optimization

What you need: AI tools that help your small team produce the volume and variety of content required to compete — without sacrificing the technical accuracy your buyers demand. For what that output looks like in practice, see our content marketing examples for manufacturers.

Practical stack:

  • AI writing assistance: Claude, ChatGPT, or Jasper for first drafts and ideation — but always with SME review for technical content. An AI-generated whitepaper on metallurgical properties that contains a factual error will destroy credibility with your engineering audience faster than no content at all.
  • SEO optimization: Surfer SEO, Clearscope, or MarketMuse for keyword optimization and content scoring
  • Visual content: AI image generation for blog illustrations, Canva’s AI features for social assets, and tools like Synthesia for scalable video content

The golden rule: AI generates the 80% (structure, research synthesis, first draft). Your subject matter experts contribute the 20% that makes it credible and differentiated (proprietary data, real application examples, technical validation). This ratio lets a one-person marketing operation publish at the cadence of a five-person team.

Layer 4: Distribution + Engagement — Getting Content to Buyers

What you need: Automated distribution across the channels where manufacturing buyers actually spend time. The channel-by-channel detail sits in our guide to digital marketing for manufacturers.

  • LinkedIn: Still the #1 channel for B2B manufacturing. AI tools like Taplio or Shield help optimize posting cadence and content format. LinkedIn’s own Campaign Manager now includes AI audience expansion and predictive bidding.
  • Email: AI-optimized send times, subject lines, and content personalization (native in HubSpot, Mailchimp, and most modern ESPs)
  • Paid search/display: Google’s Performance Max campaigns use AI to distribute budget across channels. For manufacturers, supplement with industry-specific platforms like ThomasNet, Engineering360, or GlobalSpec.
  • Trade publication syndication: Don’t overlook industry media. AI can help identify which publications drive the most qualified referral traffic and suggest topics aligned with editorial calendars.

Building Your 90-Day AI Marketing Roadmap for Manufacturers

This is where most guides leave you hanging. They explain what AI can do but not how to actually get started — especially if you’re a mid-market manufacturer with limited internal marketing resources. Here’s the phased approach we use with clients implementing AI marketing for manufacturers.

Phase 1: Foundation (Days 1–30)

Goal: Get your data house in order and implement the core AI-enabled platform.

Week 1–2: Audit and clean your data. Start with a structured marketing audit so you know what you actually have.

  • Export your CRM contacts and score data quality (email validity, company name standardization, industry classification, buying stage accuracy)
  • Map your existing content inventory: what do you have, what topics does it cover, what’s outdated?
  • Document your last 20 closed-won deals: who was involved, what content did they engage with, how long was the cycle?

Week 3–4: Platform setup.

  • Implement or configure your CRM/marketing automation platform with AI features enabled
  • Set up visitor identification on your website
  • Create your baseline lead scoring model (start simple — you’ll refine it as AI learns from your data)
  • Configure basic email automation: welcome sequence, re-engagement sequence, and one product-specific nurture

Deliverable: A functioning AI-enabled marketing platform with clean data, basic automation, and lead scoring active.

Phase 2: Content Engine (Days 31–60)

Goal: Build the content foundation that feeds your AI personalization and SEO strategy.

Week 5–6: Keyword and topic strategy.

  • Use AI-powered SEO tools to identify the informational and commercial keywords your buyers search for
  • Map keywords to buying stages and stakeholder roles
  • Create a 6-month editorial calendar with AI-assisted topic ideation

Week 7–8: Content production sprint.

  • Produce 4–6 foundational content pieces using the AI-assisted workflow (AI draft → SME review → optimization → publish)
  • Prioritize content that serves multiple buying committee roles (e.g., a comprehensive guide that includes both technical specs and ROI analysis)
  • Create at least one interactive tool: ROI calculator, product selector, or specification comparison tool — AI makes these dramatically easier to build

Deliverable: A content library that covers your primary product/service categories with buyer-stage-appropriate assets, optimized for search.

Phase 3: Intelligence and Optimization (Days 61–90)

Goal: Activate the advanced AI capabilities — intent data, predictive scoring, and account-based personalization.

Week 9–10: Activate intent data and account identification.

  • Turn on third-party intent monitoring for your target accounts and key topics
  • Set up automated alerts when target accounts show research behavior
  • Create account-specific landing pages or content hubs for your top 20 target accounts

Week 11–12: Optimize and scale.

  • Review AI lead scoring accuracy: are high-scored leads actually converting at a higher rate? Adjust the model.
  • Analyze content performance: which AI-recommended topics are driving qualified traffic? Double down.
  • Set up multi-touch attribution reporting to understand which channels and content pieces influence deals
  • Document your playbook: what’s working, what’s not, what to scale in the next quarter

Deliverable: A fully operational AI marketing system that identifies, engages, and qualifies prospects with minimal manual intervention.

Measuring ROI: AI Marketing KPIs for Manufacturers That Actually Matter

AI gives you access to more data than ever. The risk, however, is drowning in vanity metrics that don’t connect to revenue. Here are the KPIs that matter for manufacturers using AI marketing, and how AI improves each one.

Leading Indicators (Marketing-Controlled)

KPIWhat AI ChangesTarget Improvement
Marketing Qualified Leads (MQLs)AI scoring replaces gut-feel qualification30–50% improvement in MQL-to-SQL conversion rate
Website-to-lead conversion ratePersonalized CTAs and content2–3x improvement over static pages
Content engagement by personaAI segments engagement by stakeholder roleEnables committee-level pipeline visibility
Organic search visibilityAI-assisted content at higher volume and relevance5–10x keyword coverage in first 6 months

Lagging Indicators (Revenue-Connected)

KPIWhat AI ChangesTarget Improvement
Sales cycle lengthMulti-threaded nurture reduces consensus-building time15–25% reduction
Pipeline velocityIntent data accelerates early-stage engagement20–30% increase in pipeline progression speed
Customer acquisition cost (CAC)AI eliminates wasted spend on unqualified channels20–40% CAC reduction
Revenue attribution to marketingMulti-touch attribution replaces last-click guessingAccurate picture of marketing’s revenue contribution

The critical manufacturing caveat: With 6–18 month sales cycles, don’t expect AI marketing for manufacturers to show revenue impact in 90 days. Leading indicators (traffic, lead quality, engagement depth) should improve within the first quarter. Pipeline and revenue impact typically becomes measurable in months 6–9. Any vendor promising faster manufacturing marketing ROI is either selling you something or doesn’t understand your business.

5 AI Marketing Mistakes Manufacturers Make (and How to Fix Them)

After implementing AI marketing strategies for industrial B2B companies, we’ve seen the same failure patterns repeatedly. Here’s how to avoid them.

Mistake 1: Starting with Tools Instead of Strategy

“We bought 6sense and HubSpot Enterprise, but nothing changed.” We hear this constantly, particularly right after a big platform purchase. AI tools amplify your strategy — they don’t replace it. However, if you don’t have clear ICPs, defined buyer journeys, and content that addresses real buyer questions, AI just automates the wrong things faster.

Fix: Complete Phase 1 of the roadmap above before purchasing anything beyond your core CRM.

Mistake 2: Treating AI Content as a Volume Play

Some manufacturers interpret “AI-assisted content” as “publish 50 blog posts per month generated entirely by AI.” This is one of the most common reasons AI B2B marketing fails. The result: a blog full of generic, technically shallow content that engineering buyers see through immediately.

Fix: Use the 80/20 rule. AI handles structure, research synthesis, and first drafts. Human experts provide the technical validation, proprietary insights, and real-world application examples that build credibility with technical buyers.

Mistake 3: Ignoring the ERP/Product Data Integration

Your ERP system contains the richest data in your company: SKU-level sales trends, customer purchase patterns, regional demand variations, and inventory data. Yet most manufacturing AI marketing implementations never connect this data to the marketing stack.

Fix: Work with your marketing platform provider (or an integration specialist) to pipe key ERP data into your CRM. Even basic integrations — like syncing product categories and purchase history — dramatically improve AI personalization and lead scoring.

Mistake 4: Expecting AI to Fix Bad Sales-Marketing Alignment

AI lead scoring is meaningless if sales doesn’t trust the scores. Similarly, predictive analytics are useless if sales and marketing define “qualified” differently.

Fix: Before deploying AI scoring, get sales and marketing in a room (or on a call) to agree on: what makes a lead qualified, what information sales needs from marketing, and how leads are handed off. Then document it. Then configure AI to enforce that agreement.

Mistake 5: Neglecting Privacy and Compliance

Manufacturers often sell to regulated industries (defense, healthcare, energy). AI marketing tools that track behavior, use intent data, and personalize content must comply with GDPR, CCPA, and industry-specific regulations.

Fix: Audit your AI marketing stack for data handling practices. Also ensure consent mechanisms are in place for website tracking. Work with legal to document your data processing activities — especially if you’re selling into EU markets.

What AI Marketing for Manufacturers Looks Like When It’s Actually Working

Finally, let’s end with a concrete picture of what this looks like in practice — not a hypothetical, but the daily reality for a mid-market manufacturer with a functioning AI marketing operation.

A Week Inside a Working AI Marketing Operation

Monday morning: Your AI intent monitoring flags that three companies in your target account list have started researching thermal management solutions. Notably, two are existing contacts; one is new. Meanwhile, the system has already enrolled the existing contacts in a personalized nurture sequence and created a task for your sales rep to research the new company.

Tuesday: A mechanical engineer at one of those companies visits your website. The visitor identification tool matches them to the account. Your website dynamically displays case studies from their industry (automotive), highlights your relevant certifications, and serves a technical comparison guide as the primary CTA. So they download it. AI lead scoring bumps the account from “awareness” to “consideration.”

Wednesday: Your AI content tool analyzes last month’s organic traffic and identifies that “thermal runaway prevention in EV battery packs” is generating significant search interest but you have no content on it. It generates a content brief with keyword targets, competitor analysis, and a draft outline. Your engineering team reviews and adds their proprietary testing data. Then you publish by Friday.

How the Week Compounds

Thursday: The AI detects that three people from the same automotive account have now engaged with your content within 10 days — the engineer, a procurement manager (who found you through a LinkedIn ad), and a VP of operations (who clicked through from an industry newsletter). The system sends an account-level alert to sales: “Multi-stakeholder engagement detected. Buying committee forming. Recommended action: executive outreach.”

Friday: Your weekly AI-generated marketing report shows pipeline influence, content performance by buying stage, and lead score distribution changes. No manual spreadsheet assembly. No guessing.

That’s not science fiction. That’s a properly implemented AI marketing stack for manufacturers running on tools available today, managed by a lean team that spends their time on strategy and relationships — not manual data entry and campaign assembly.

FAQ: AI Marketing for Manufacturers

What is AI marketing for manufacturers?

AI marketing for manufacturers is the use of artificial intelligence tools — predictive analytics, machine learning lead scoring, AI-driven content creation, and automated personalization — to attract, engage, and convert industrial B2B buyers. It replaces manual, one-size-fits-all marketing with data-driven systems that adapt to each prospect’s behavior, role, and buying stage.

How much does AI marketing cost for a mid-market manufacturer?

A functional AI marketing stack for a mid-market manufacturer typically costs $2,000–$5,000/month in software (CRM, marketing automation, intent data, SEO tools). The bigger investment is the operational setup: cleaning your data, integrating systems, and building the content foundation. Working with an experienced partner can compress a 12-month DIY implementation into 90 days. Total first-year investment — tools plus implementation — usually falls between $50K and $120K, depending on scope.

Can AI replace a manufacturing marketing team?

Not replace — multiply. AI lets a one- or two-person marketing team produce the output that previously required five to eight people. The human team still owns strategy, brand voice, technical validation, and sales relationships. AI handles the repetitive, data-heavy work: segmentation, personalization, scheduling, lead scoring, and performance analysis. The result, therefore, is a lean team with disproportionate impact.

What’s the best AI marketing platform for manufacturers?

The honest answer is that the platform is the least important decision you will make. Most mid-market manufacturers already have a CRM and marketing automation system that is good enough — HubSpot and Salesforce both work well, and the one you already own usually beats the one you migrate to. What actually determines results is the layer above the platform: a documented marketing brain (your ICP, narrative, technical positioning, and product data) that your AI systems can read, plus clean data flowing between your CRM and ERP. A well-configured instance of an ordinary platform, driven by a real strategy, outperforms an expensive suite with nothing behind it every time. Increasingly the direction of travel is agents that connect to your platforms rather than living inside them — which is another reason not to over-invest in the platform choice itself.

How long before AI marketing shows ROI in manufacturing?

Leading indicators — website traffic, lead quality improvements, content engagement — typically improve within the first 60–90 days. Pipeline impact (more qualified opportunities, faster progression) becomes measurable in months 4–6. Revenue attribution in manufacturing usually requires 6–12 months due to longer sales cycles. So be skeptical of any vendor promising measurable revenue impact in under 90 days for industrial B2B.

How does AI improve trade show ROI for manufacturers?

AI transforms trade shows from a badge-scanning exercise into a precision pipeline tool. Pre-show, AI identifies which attendees are already researching your solutions and prioritizes outreach. At the event, real-time lead scoring gives your booth team instant context on every visitor. Post-show, AI triggers personalized follow-up sequences within hours — not weeks — and tracks trade show interactions through to closed deals, giving you true event ROI across long manufacturing sales cycles.

Getting Started with AI Marketing for Manufacturers: Your Next Step

If you’re a manufacturer reading this and recognizing the gap between where your marketing is and where it needs to be, you have two paths. Either way, start from a written marketing plan for manufacturing companies rather than from a tool purchase.

Path 1: Build it yourself. Follow the 90-day roadmap above. It works. It requires dedicated focus from someone on your team who can own the implementation and has enough technical comfort to configure marketing automation, manage integrations, and interpret AI-generated insights.

Path 2: Bring in a partner who’s already done it. At StepUp, we operate as a full AI-powered marketing department for global B2B manufacturers. One person on our side, powered by AI, replaces what traditionally required an entire marketing team. We handle strategy, HubSpot implementation, content, demand generation, and ongoing optimization — purpose-built for the industrial B2B sales cycle.

Either way, the window for competitive advantage is open now. The manufacturers who build their AI marketing capability in 2026 will own their categories for years. The ones who wait will be playing catch-up against competitors who already have 12 months of AI-trained data and compounding organic visibility.

Technology is ready. Your playbook is here. Whether you move first is the only variable left.

B2B Marketing Audit: The Complete Framework (Plus a Scorecard You Can Run Today, No Email Required)

Most B2B marketing audits end the same way: a 40-slide deck, a list of 30 “opportunities,” and a shelf. Nobody executes on it, because the audit was built as a deliverable, not as the first step of a plan. It diagnosed the patient and then left the room.

That’s the gap this guide is built to close. Below is a full framework for running a B2B marketing audit — what it covers, how to score it, and, critically, what to do with the findings once you have them. We’ve also built in something almost none of the guides ranking for this term include: a dedicated module for auditing how AI is (or isn’t) actually integrated into your marketing function, beyond whether someone on the team has played with ChatGPT. AI visibility, AI-assisted production, AI-readiness of your data — these are now real audit categories, not a bonus chapter.

We run these audits constantly at StepUp, almost always as the front door to a longer marketing execution engagement. So this isn’t theoretical. It’s the same rubric, the same scorecard, and the same prioritization logic we use with clients before we start building anything. Use it to audit your own program, or use it to sanity-check an audit someone else handed you.

What Is a B2B Marketing Audit? (And What It Isn’t)

A B2B marketing audit is a structured evaluation of every system that produces or should produce pipeline: your strategy and ICP definition, your positioning and messaging, your website and conversion paths, your organic and paid demand engines, your content operation, your marketing technology stack, your sales-marketing alignment, and your measurement and attribution setup. The output is a scored, prioritized view of what’s working, what’s broken, and what’s missing entirely — ranked by revenue impact, not by how interesting the finding is.

It is not a brand audit (which focuses narrowly on visual identity, tone, and market perception). It is not a website audit (which is one input into the marketing audit, not the whole thing). And it is not a competitive analysis on its own, though competitive benchmarking is a required component.

The distinction that matters most: a marketing audit is diagnostic, not decorative. If the output doesn’t come with a prioritized action list and doesn’t get executed within 90 days, it wasn’t an audit — it was a report. Every section below is built around that standard.

Why (and When) You Need a B2B Marketing Audit

Most companies don’t audit on a schedule. They audit when something triggers it. If you’re reading this because one of the following is true, you’re not early — you’re on time.

When Your Pipeline or Your Team Changes

Pipeline has stalled without an obvious cause. MQLs look fine, ad spend hasn’t changed, but SQLs and closed-won are flat or declining. This usually means the breakdown is happening in a place nobody’s dashboard is set up to catch — lead quality, sales follow-up speed, or a messaging mismatch between what marketing promises and what sales actually sells.

A new CMO or VP Marketing just started. The single highest-leverage thing a new marketing leader can do in the first 30 days is get an unfiltered, evidence-based picture of what they inherited — not the version their predecessor’s team presents in the first all-hands. An audit gives a new leader a paper trail to point to when they make changes, instead of “the new person just wants to do things differently.”

When Your Funding, Brand, or Search Traffic Changes

You just raised a round. New capital means new investor expectations around growth velocity, and usually a board asking pointed questions about CAC, pipeline coverage, and time-to-close. An audit before you scale spend is far cheaper than scaling a broken funnel and finding out six months later.

You’re rebranding or repositioning. A rebrand that isn’t preceded by an audit of what’s currently converting is a rebrand built on guesses. You need to know which existing messaging, pages, and campaigns are actually earning pipeline before you decide what to keep.

Organic traffic and rankings have gone flat — or AI search is quietly eating your visibility. This is the newest trigger, and it’s the one most audit guides ignore entirely. If your traffic has plateaued while your content output hasn’t changed, the cause increasingly isn’t a Google algorithm update — it’s that a growing share of your buyers’ research is now happening inside ChatGPT, Perplexity, and Google’s AI Overviews, and your content isn’t structured to be cited there. A 2023-era SEO audit won’t catch this. You need a category built specifically for it (more on that below).

If two or more of these are true right now, don’t wait for a quarterly planning cycle. Run the audit this month.

What a Full B2B Marketing Audit Actually Covers: The 9 Pillars

Most audits published online cover three or four of these and call it comprehensive. A real B2B marketing audit touches all nine, because a weakness in any one of them can quietly cap the performance of the other eight.

1. Strategy & ICP Definition

Is there a documented, specific ideal customer profile — firmographics, technographics, buying triggers, and disqualifiers — or does “our ICP” live only in the founder’s head? Audit whether current pipeline actually matches the stated ICP, or whether the team is closing deals outside it and rationalizing afterward. Misalignment here invalidates almost everything downstream: targeting, messaging, content, and ad spend all inherit the ICP’s blind spots.

2. Positioning & Messaging

Does the messaging answer “why us, why now, why not a competitor or the status quo” in language a buyer would actually use — or is it interchangeable with any competitor’s homepage with the logo swapped out? Pull messaging from the website, sales deck, and top three pieces of content, and check whether they say the same thing. Inconsistency here is one of the most common findings in any audit, and one of the cheapest to fix.

3. Website & Conversion Architecture

Beyond page speed and design, audit the buyer journey itself: does the site route a visitor from awareness to a qualified conversion action in a logical number of steps, or does every page dead-end at a generic “Contact Us”? Check conversion rate by traffic source and by page template, not just in aggregate — a healthy blended rate can hide a homepage that’s converting at a third of the site average.

4. SEO & Organic (Including AI) Search Visibility

Traditional technical SEO — indexation, site architecture, backlink profile, keyword rankings — plus the newer layer: is content structured so LLMs can parse and cite it? This pillar gets its own deep module below, because it’s the single biggest gap in every competing audit guide currently ranking for this term.

5. Content Operation

Audit volume, but weight it against relevance and conversion contribution. A blog publishing three posts a week that none of the sales team has ever referenced in a deal is a content operation optimized for vanity output, not pipeline. Map content against the buyer journey stage it’s meant to serve and flag the gaps — usually at bottom-of-funnel, where most B2B content libraries are thinnest.

6. Demand Generation & Paid Media

Channel mix, spend efficiency, CAC by channel, and — critically — whether paid spend is compensating for a positioning or targeting problem instead of a genuine growth lever. It’s extremely common to find a company throwing more budget at LinkedIn ads to hit pipeline targets that a messaging fix would have solved for free.

7. Marketing Operations & Tech Stack

CRM and marketing automation platform configuration, lead scoring and routing logic, data hygiene, integration health between systems. This is the least glamorous pillar and the one most often skipped in DIY audits — and also the one most likely to be silently costing 20-30% of marketing-sourced pipeline through broken routing rules or duplicate/dirty records nobody’s looked at in two years.

8. Sales & Marketing Alignment

Shared definitions of an MQL and SQL, actual (not theoretical) follow-up SLAs on leads, feedback loop from sales back to marketing on lead quality. Interview sales reps directly — what they say about lead quality almost never matches what the CRM dashboard says.

9. Analytics & Attribution

Can the team actually trace a closed-won deal back to the marketing touches that influenced it, or is attribution a single “lead source” field filled in by whoever happened to be in the room? Audit whether the reporting stack answers the two questions leadership actually asks — what’s driving pipeline, and what should we spend more or less on — or just produces activity metrics that don’t map to either.

The B2B Marketing Audit Scorecard (Use This — No Email Required)

Score each pillar honestly, 0 to 3. Be specific with evidence for every score — “we have a documented ICP” only counts as a 3 if you can produce the document and confirm it’s been used to disqualify a deal in the last quarter.

The Nine Pillars, Scored 0 to 3

Pillar 0 — Absent 1 — Ad hoc 2 — Defined but inconsistent 3 — Documented, active, measured
Strategy & ICP No documented ICP ICP exists but isn’t used in targeting decisions ICP documented, used inconsistently across teams ICP documented, actively used to qualify/disqualify, revisited quarterly
Positioning & Messaging No differentiated point of view Some differentiation, inconsistent across assets Consistent on website, inconsistent in sales/content Consistent across every buyer touchpoint, tested against competitors
Website & Conversion No clear conversion path Generic contact forms only Stage-specific CTAs, no conversion tracking by page Full conversion tracking by page/source, active CRO program
SEO & AI Search Visibility Not tracked Ranking tracked, no AI-search consideration Ranking tracked, AI visibility unmeasured Ranking + AI citation tracked, content structured for both
Content Operation No content calendar or strategy Publishing without a stated purpose per piece Mapped to funnel stage, not tied to pipeline data Mapped to funnel stage, sales-validated, tied to influenced pipeline
Demand Gen & Paid No paid channels or untracked spend Spend active, CAC not tracked by channel CAC tracked, not benchmarked against LTV CAC tracked by channel, benchmarked, budget reallocated quarterly
Marketing Ops & Tech Stack No CRM/MAP or totally unconfigured Basic setup, no lead scoring/routing Scoring and routing exist, not audited in 12+ months Scoring, routing, and data hygiene actively maintained and audited
Sales & Marketing Alignment No shared lead definitions MQL/SQL defined, not enforced SLAs exist, feedback loop informal SLAs enforced, structured feedback loop, shared dashboard
Analytics & Attribution No attribution model Single-touch/last-touch only Multi-touch attempted, not trusted by leadership Multi-touch attribution trusted and used in budget decisions

How to Read Your Score

  • 0-9: Foundational gaps. Marketing is running on instinct. Don’t scale spend until the fundamentals — ICP, positioning, ops hygiene — are addressed. Scaling now amplifies the confusion, not the results.
  • 10-17: Inconsistent execution. The building blocks exist but aren’t connected. This is the most common score range, and the fastest to move — usually the fixes are integration and enforcement, not invention.
  • 18-23: Solid, with real gaps. Core systems work. The audit’s job here is to find the two or three specific leaks costing the most pipeline, not to rebuild everything.
  • 24-27: Optimization territory. Most companies never reach this range. Here the audit shifts from fixing broken things to finding marginal-gain opportunities and AI-driven efficiency plays.

Run this with more than one person scoring independently before comparing notes — a marketing leader and a sales leader will frequently score the same pillar two or three points apart, and that gap is itself a finding.

How to Run a B2B Marketing Audit: The Process, Step by Step

1. Gather the data room

Before any scoring happens, pull: last 12 months of traffic and conversion data by source, CRM export of lead-to-close data with source attribution, current messaging assets (website, deck, one-pagers), paid media performance by channel, and content inventory with publish dates and topics. Most audits fail at this step because the data doesn’t exist in a usable form — that gap is itself worth noting as a finding, not just a blocker.

2. Run stakeholder interviews

Talk to marketing, sales leadership, at least two individual sales reps, and — if you can get access — customer success. Ask each the same three questions: What’s our ICP? What’s the one thing that makes us different from [named competitor]? What’s the biggest reason deals fall through? The variance in answers across roles tells you more than any dashboard will.

3. Score against the scorecard

Use the table above. Score independently, then reconcile as a group, documenting evidence for each score — not opinion.

4. Benchmark against real competitors

Pull the same visible signals for two or three direct competitors: their positioning language, their content cadence, their apparent paid strategy, their SEO and AI search visibility. This isn’t about copying them — it’s about knowing whether a weakness you found internally is a category-wide norm (lower priority) or a genuine gap versus the field (higher priority).

5. Build the impact/effort prioritization matrix

This is the step every audit guide skips, and it’s the one that determines whether the audit actually gets executed. Plot every finding on a simple 2×2: revenue impact (low/high) against effort to fix (low/high). Everything in the high-impact, low-effort quadrant gets scheduled in the next two weeks. High-impact, high-effort gets scoped into the next planning cycle. Low-impact items — regardless of how easy — get parked. This is the difference between a 30-item report nobody acts on and a 6-item plan that ships.

The AI-Integrated Marketing Audit Module (What Most Audits Miss)

This is the section that separates a 2026-relevant audit from a template that hasn’t been updated since 2021. Every guide ranking for “b2b marketing audit” today either ignores AI entirely or treats it as a single line item about “using AI tools.” Neither is adequate anymore. AI now touches at least four distinct parts of a B2B marketing operation, and each deserves its own audit pass.

AI / answer engine visibility

A growing share of B2B research now happens inside ChatGPT, Perplexity, and Google’s AI Overviews before a buyer ever visits a vendor site. Audit whether your brand, your category expertise, and your key differentiators show up when you (and a few teammates, on different accounts) ask the tools the questions your buyers would actually ask — “best [category] for [use case],” “how does [your category] work,” “[your company] vs [competitor].” If you’re invisible in those answers, you’re invisible at a stage of the funnel that traditional SEO audits don’t measure at all. Then audit why: is your content written in a way that directly answers a question in the first two sentences, with clear structure LLMs can extract and cite — or is it buried under three paragraphs of scene-setting before it gets to the point? Content built for AI citation and content built for human scroll-depth aren’t the same asset, and most B2B content libraries have only ever optimized for the second.

AI in content production

Audit the content operation for two failure modes, not one. The obvious one: AI-generated content published with no editing, no expert point of view, no specificity — the kind that reads like it could belong to any company in the category, which both readers and search engines increasingly discount. The less obvious one, and the one that actually costs pipeline: teams avoiding AI tools entirely out of caution, and as a result producing a third of the content volume a lean team could sustain with AI used as a legitimate drafting and research accelerant, human-edited for accuracy and voice. What this part of the audit asks isn’t “are they using AI” — it’s “is AI making the human expertise scale further, or is it replacing the human expertise altogether.” Those produce opposite results.

AI in marketing operations

Beyond content, audit where AI is (or should be) doing real operational work: lead scoring models, intent data enrichment, personalization at scale on the website or in email sequences, sales-call analysis feeding back into messaging. Most companies have a chatbot on the website and call that “AI-integrated marketing.” Score honestly on whether AI is embedded in a system that touches revenue, or whether it’s a surface-level feature nobody on the leadership team could describe the ROI of.

AI-readiness of your data

None of the above works without clean, structured, accessible data. Audit whether your CRM and marketing automation data is clean enough to actually feed an AI-driven scoring or personalization model, or whether duplicate records, inconsistent field usage, and years of unmaintained lead source data would produce garbage output from any AI layer you bolt on top. This is the least visible finding in this entire audit and frequently the one with the highest payoff to fix, because it’s a prerequisite for every other AI initiative on the roadmap.

Score this module the same 0-3 way as the nine pillars above, across these four sub-areas, and treat a low score here as equally urgent as a low score on ICP or positioning — not as a “nice to have” appendix.

Common Red Flags We Find in B2B Marketing Audits

A few patterns show up often enough across audits that they’re worth naming directly:

  • The ICP on paper isn’t the ICP in the CRM. The stated target customer and the actual profile of closed-won deals from the last four quarters frequently don’t match — and nobody’s reconciled the two.
  • Sales and marketing define “qualified” differently, and neither side has said so out loud in a meeting. This alone explains a huge share of “marketing sends leads sales ignores” complaints.
  • The website’s best-converting page isn’t the homepage — and marketing’s biggest spend and attention is still going toward the homepage.
  • Content volume is high, bottom-funnel content is nearly nonexistent. Most libraries are stacked with top-of-funnel educational posts and almost nothing that helps a buyer in active evaluation choose you specifically.
  • Attribution data exists but nobody trusts it, so budget decisions are still made on instinct — which defeats the purpose of having built the reporting in the first place.
  • AI tools are being used somewhere in the org, informally, without anyone coordinating it — one person on the content team, one AE using it for call prep — with no shared standard and no measurement of whether it’s actually working.

If two or more of these show up in your own scorecard, they’re very likely costing more pipeline than whatever “big idea” campaign is currently getting leadership’s attention.

From Audit to Action: Turning Findings Into an Execution Plan

Here’s the part almost every audit guide leaves out, and it’s the part that actually determines whether the audit was worth running: the audit is not the deliverable. The prioritized execution plan built from it is.

A finding like “positioning is inconsistent across the website and sales deck” is useless sitting in a slide. It only creates value once it’s translated into a scoped action — new positioning drafted, validated against the ICP, rolled out across every asset, and measured for its effect on conversion within a defined window. The same is true for every other finding: a marketing ops fix isn’t done when it’s identified, it’s done when the lead routing rule is rebuilt and tested. An AI visibility gap isn’t closed by noting it — it’s closed by restructuring the specific pages that should be earning AI citations and remeasuring in 60 days.

This is why we treat every audit at StepUp as the first phase of a marketing execution engagement, not a standalone report handed off with a “good luck.” The prioritization matrix from Step 5 above becomes the first sprint of actual work — the high-impact, low-effort fixes get built in the first two weeks, not scheduled for “next quarter” and forgotten. If you’re running this audit internally, the practical takeaway is the same regardless of who does the work: don’t consider the audit finished until every item in the top-right quadrant of your prioritization matrix has an owner, a deadline, and a way to measure whether it worked. An audit with no execution attached to it is a very expensive way to confirm what you probably already suspected.

DIY Audit vs. Hiring an Outside Partner

You can run everything above internally, and for a smaller team or an early-stage company, that’s often the right call — the scorecard doesn’t require outside expertise to use honestly.

Bringing in an outside partner makes sense in a few specific situations: when internal politics make an honest score impossible (nobody wants to be the one who tells the CMO their pillar is a 1), when the team doesn’t have the bandwidth to do the interviews and data-pulling on top of day-to-day execution, or when you specifically want the competitive-benchmarking and AI-visibility analysis done by someone who’s run it across dozens of other B2B companies and has a reference point for what “good” actually looks like in your category. The other reason companies bring in an outside audit specifically: they want the audit to lead directly into execution, with the same team that diagnosed the problem building the fix — rather than handing a report to an internal team that’s already stretched thin and watching it stall for the same reason the last one did.

B2B Marketing Audit FAQ

How much does a B2B marketing audit cost?

A DIY audit using the framework above costs internal time only — typically 15-25 hours across a small team spread over one to two weeks. An outside agency-run audit generally ranges from $3,000 to $15,000 depending on depth, company size, and whether it includes the AI visibility and marketing ops technical review, or just the strategic/messaging layer. Be cautious of anything priced far below that range for a “comprehensive” audit — it’s usually a templated report with limited original data-pulling or interviews.

How long does a B2B marketing audit take?

Two to four weeks for a full nine-pillar audit including stakeholder interviews, competitive benchmarking, and the AI module. A lighter version focused only on one or two pillars (e.g., just SEO and content) can be done in a week. Anything promising a comprehensive audit in 48 hours hasn’t actually pulled and reconciled the data.

What’s the difference between a marketing audit and a brand audit?

A brand audit is narrower — it evaluates visual identity, tone of voice, and market perception, usually as an input into a rebrand. A B2B marketing audit is broader and operational: it covers strategy, ICP, conversion, demand gen, ops, sales alignment, and measurement, with positioning and brand as one pillar among nine, not the whole scope.

What deliverables should you expect from a B2B marketing audit?

At minimum: the completed scorecard with evidence for each score, a competitive benchmark summary, and a prioritized impact/effort action list with owners and timelines attached. If the deliverable is only a narrative report with no scoring and no prioritization, push back and ask for those two additions before considering it complete.

How often should you run a B2B marketing audit?

A full audit annually is a reasonable baseline for most B2B companies. Beyond that, run a targeted re-check any time one of the trigger events from earlier in this guide occurs — new leadership, a funding round, a rebrand, or a stalled pipeline — rather than waiting for the calendar.


If you’ve scored yourself against the table above and landed somewhere below 18, or if the AI-integrated module scored lower than everything else, that’s the honest starting point — not a reason to wait until it’s “more figured out” before getting outside eyes on it. Every finding in this framework is only worth the sprint it turns into.

B2B Competitor Analysis: A Complete Framework, Template, and AI Workflow That Actually Drives GTM Decisions

Most B2B competitor analyses die the same way: someone spends three weeks building a 40-slide deck, presents it once in a Q3 planning meeting, and it never gets opened again. The competitors’ pricing changes six weeks later. Nobody notices. The deck sits in a shared drive labeled “Competitive_Analysis_FINAL_v3.pptx” until someone repeats the entire exercise from scratch a year later.

That’s not a research problem. That’s an execution problem — and it’s the same failure mode we see across most B2B marketing work: a lot of smart analysis that never turns into a decision, a message, a page, or a deal won.

This guide is built differently. It’s not a checklist of things to “consider.” It’s the actual framework we run at StepUp when we take on a new marketing engagement — the research matrix, the SWOT method that isn’t just four empty quadrants, the AI-assisted research workflow that cuts the grunt work from weeks to hours, a tool-agnostic comparison of what’s actually worth paying for in 2026, a template you can copy directly into a doc today, and a full worked example so you can see exactly what “done well” looks like. We’ve also included a section nobody else in this space covers: how competitor analysis actually works in industrial and medtech B2B, where the competitive landscape, the buying committee, and the content itself look nothing like SaaS.

If you want the theory, there are a dozen glossary pages that will give it to you. If you want to walk out with something you can run this week, keep reading.

What “B2B Competitor Analysis” Actually Means (And Why Most Are a Waste of Time)

A B2B competitor analysis is the systematic process of identifying who you’re actually losing (and winning) deals against, understanding how they position, price, sell, and market, and translating that into decisions — about your messaging, your product roadmap, your pricing, your content strategy, and your sales enablement.

That last clause is the part almost every guide skips. Research that doesn’t change a decision isn’t analysis — it’s trivia.

Here’s why most B2B competitor analyses fail before they even start:

They’re built around a template, not a question. Teams fill in a “company/customers/product/pricing” grid because that’s what the template asked for, not because those are the four things that will actually move their win rate. A field sales team losing on discovery calls needs objection-handling intel. A demand gen team losing on paid search needs a content and keyword gap. Same company, different competitor analysis.

They treat “competitor” as a fixed list. Most teams name the three or four companies they see in every deal and stop there. They miss the indirect competitor eating budget (status quo, spreadsheets, in-house builds), the aspirational competitor customers compare you to even though you don’t compete for the same deals, and the emerging competitor that will be a top-3 threat in 18 months but shows up in zero deals today.

They’re a snapshot, not a system. A one-time analysis is out of date within a quarter. Pricing changes, messaging pivots, a competitor gets acquired or raises a round and repositions overnight. Without a light cadence for refreshing it, the analysis is accurate for exactly as long as it takes to present it.

Most Competitor Analyses Stop at Description

“Competitor X emphasizes ease of use in their homepage hero” is an observation. “Competitor X emphasizes ease of use because they’re weak on technical depth — our sales team should lead with our engineering credentials on any deal where X is in the room” is analysis. Most documents never make that jump.

The framework below is built to avoid all four traps.

The StepUp Framework: 8 Steps From Research to Revenue

We run this as a repeatable process, not a one-off project. Each step produces an artifact your team can actually use — not just a slide.

Step 1: Define Who’s Actually a Competitor (Four Categories, Not One List)

Before you research anything, sort your competitive landscape into four buckets. Skipping this step is the single biggest reason competitor analyses miss the real threat.

Direct competitors — companies selling a comparable solution to the same buyer, and the ones your sales team names in deal notes today. Pull this list from CRM “lost to competitor” fields and win/loss interview notes, not from a Google search. If your sales team isn’t logging it, fix that first — a competitor analysis built on guesswork about who you’re actually up against is worthless.

Indirect competitors — different solution category, same budget line and same problem. For a marketing ops platform, this might be a well-staffed internal team doing the job manually in spreadsheets, or an adjacent tool (a CRM’s built-in feature) that’s “good enough” to kill the deal. Indirect competitors are invisible in most analyses because they don’t show a logo — but “no decision” and “we’re building it ourselves” often beat every named competitor combined.

Aspirational competitors — companies your buyers compare you to even though you’re not actually fighting for the same deal size or segment. Prospects will say “we love how Company Y does X” even if Y is enterprise-only and you’re mid-market. These shape buyer expectations for category-defining features, UX, and content quality even when they never show up as a lost deal.

Emerging/watch-list competitors — recently funded, recently launched, or repositioning fast. Track these separately with less depth but a standing alert (Google Alerts, a Crunchbase saved search, or an AI-agent monitoring workflow — see the AI section below). The goal isn’t a full teardown today; it’s not being blindsided in six months.

What Step 1 Should Produce

a one-page competitor map, four rows, with 3–6 names in each. This alone is often more useful than most companies’ entire existing competitive deck, because it’s the first time anyone has separated “who we lose to” from “who we think about.”

Step 2: Build the Research Matrix (What to Actually Track)

This is where most published guides stop at four fields — company, customers, product, pricing — because that’s what fits in a blog post screenshot. It’s not enough to run a real commercial decision through. Here’s the full matrix we use, organized by what it’s actually for.

Positioning & messaging

  • Homepage headline and subhead (their literal words — don’t paraphrase)
  • Category they claim to own or create
  • Primary value proposition and the three supporting proof points they lead with
  • Target persona(s) implied by their language and case studies
  • Tone and voice (technical/credibility-led vs. outcome/ROI-led vs. simplicity-led)

Product & packaging

  • Core feature set mapped against yours (a simple has/doesn’t-have/partial grid)
  • Packaging tiers and what’s gated behind each
  • Integrations and ecosystem partnerships
  • Roadmap signals (release notes, changelog, job postings for specific technical roles)

Pricing & commercial model

  • List pricing if published; if not, pull from win/loss notes and public G2 or Capterra reviews mentioning price
  • Contract length, minimum commitment, discounting patterns your sales team has observed
  • Free trial/freemium motion vs. sales-led/demo-gated

Content & SEO

  • Top 20 organic keywords and estimated traffic (pull from Semrush or Ahrefs)
  • Content cadence and format mix (blog, gated reports, webinars, video)
  • Backlink profile — who’s linking to them that isn’t linking to you
  • Where their organic footprint is genuinely strong vs. where it’s thin (this becomes your content gap plan)

Sales motion and commercial model

  • Sales-led vs. product-led vs. hybrid
  • Average sales cycle if visible from case studies or win/loss notes
  • Objection patterns your reps hear in deals where this competitor is present
  • Channel partners, resellers, or systems integrators they’ve enabled

Brand and Social Proof Signals

  • Review site ratings and, more importantly, the actual text of their negative reviews (this is where real weaknesses surface)
  • Case study depth and specificity — vague logos-and-quotes vs. named metrics
  • LinkedIn posting cadence and engagement, executive visibility

Talent & signals

  • Job postings (reveals where they’re investing — AI/data roles, vertical specialists, new geo hires)
  • Recent funding, leadership changes, and M&A activity

You will not fill in every field for every competitor with the same depth — direct competitors get the full matrix, aspirational and emerging competitors get the top third. That’s intentional; depth should follow deal impact.

Step 3: Run SWOT the Way It’s Supposed to Work (Not Four Empty Boxes)

Every competitor analysis guide includes a SWOT template. Almost none explain how to fill it in without producing generic mush like “Strength: strong brand” or “Weakness: high price.” Here’s the discipline that makes SWOT actually useful:

Every SWOT entry needs a source, not an opinion. “Strong brand” isn’t a SWOT entry. “47 G2 reviews in the last 90 days averaging 4.6 stars, three of which specifically cite onboarding speed” is. If you can’t cite where it came from — a review, a job posting, a win/loss call, a pricing page — it doesn’t go in.

Strengths and Weaknesses are about them; Opportunities and Threats are about you. This is the distinction most templates blur. Strengths/Weaknesses = an honest external assessment of the competitor. Opportunities/Threats = what that assessment means for your business specifically. “They have weak technical documentation” is a Weakness. “We can win technical buyers by publishing the integration depth content they won’t” is the Opportunity derived from it. Every S and W should produce at least one O or T — if it doesn’t, it’s not actionable and probably doesn’t belong in the final deliverable.

Run it per-competitor, then roll up a pattern view. A single combined SWOT across five competitors averages out the signal. Do it individually, then look across all of them for the pattern: are three of your five competitors weak in the same place? That’s not a competitor weakness anymore — it’s a category gap you can own.

Weighting SWOT by Deal Stage

A weakness that matters at the awareness stage (thin content, poor SEO) is a different kind of opportunity than a weakness that matters at the negotiation stage (rigid contract terms, poor support reputation). Tag each entry with where in the funnel it’s actionable — this is what turns SWOT from a document into a set of instructions for marketing and sales.

Step 4: Do a Real Messaging and Positioning Teardown

This is the step generic checklists skip entirely, and it’s often the highest-leverage one. Pull the actual language — homepage, category pages, top three case studies, most recent product launch — for every direct competitor and lay it side by side. You’re looking for:

The category claim. Are they trying to own a new category name, or fighting inside an existing one? Companies that successfully create a category (rather than compete within one) usually win the language war before the sales conversation even starts. If a competitor is pushing a new term into the market, decide deliberately whether you adopt it, ignore it, or counter-position against it — don’t let it happen by default.

The proof architecture. Do they lead with logos, with metrics, with third-party validation (analyst mentions, awards), or with narrative case studies? This tells you what their buyer actually responds to and where your own proof might be weaker than theirs by comparison, not in absolute terms.

What They Never Say

This is the most underused signal in a teardown. If every competitor talks about speed and ease of use but nobody mentions security, compliance, or technical depth, that silence is your opening — either because the whole category has a blind spot (opportunity) or because it’s genuinely not a differentiator buyers care about (worth validating before you build a campaign around it).

Where their language is generic vs. specific. Vague copy (“empower your team,” “unlock growth”) signals either an early-stage brand still finding its positioning, or a company that’s stopped investing in messaging discipline. Specific copy (named integrations, named outcomes, named personas) signals a mature commercial operation you should take seriously.

Build this as a simple side-by-side grid: competitor name, headline, three supporting claims, one-line assessment of their positioning strategy. This single artifact is often more valuable to a marketing team than the entire rest of the analysis, because it’s directly usable in a messaging workshop.

Step 5: Analyze Pricing and Packaging Like a Buyer, Not a Spectator

Don’t just record the number on the pricing page — most B2B companies don’t put a real number there anyway. Instead:

  • Map what’s included at each tier against what buyers actually need at each stage of adoption. Gating a table stakes feature behind an expensive tier is a real weakness you can exploit in positioning (“no add-on fees for X”).
  • Cross-reference with win/loss notes for actual quoted prices in real deals — list price and street price are often very different, and the gap tells you how much margin they’re protecting vs. how aggressively they’re discounting to win.
  • Note contract flexibility. In B2B, month-to-month vs. annual-only, and easy downgrade vs. locked commitment, are often bigger deal-breakers than the headline price.
  • Watch for packaging changes over time (use the Wayback Machine on their pricing page) — a shift from usage-based to seat-based, or the sudden appearance of an “Enterprise — Contact Us” tier, tells you where their business model pressure is coming from.

Step 6: Run the Content and SEO Gap Analysis

This is where a competitor analysis starts paying for itself in pipeline, not just insight. Using Semrush, Ahrefs, or a comparable tool:

  1. Pull the top 50–100 organic keywords for each direct competitor.
  2. Filter for keywords with real commercial or mid-funnel intent (not just brand terms).
  3. Cross-reference against your own ranking keywords to find the gap — terms they rank for that you don’t.
  4. Segment the gap into three buckets: quick wins (you have relevant content that just needs strengthening or a better title/structure), content gaps (topic doesn’t exist on your site at all), and not worth it (low relevance to your actual ICP despite the competitor ranking).
  5. Do the same exercise on backlinks — who links to them and not you, and whether those are realistic outreach or guest post targets.

This step alone routinely surfaces 15–30 concrete content briefs, which is a far more useful output than a paragraph describing their “content strategy” in the abstract.

Step 7: Teardown Their Sales Motion and Commercial Structure

Competitor analysis usually stops at marketing, but the buying committee doesn’t experience your competitor through their homepage — they experience them through a sales rep. Pull this together from your own sales team, not from public sources:

  • Ask reps directly: “When you’re up against Competitor X, what do they say about us, and what do we struggle to counter?” Do this as a structured 15-minute interview, not a Slack message — you’ll get much better answers.
  • Log objection patterns by competitor in your CRM if you aren’t already (a simple picklist field on closed-lost opportunities pays for itself fast).
  • Identify their sales cycle length and deal structure from public case studies and from your own team’s read on deals where the prospect evaluated both.
  • Map their partner and channel ecosystem — a competitor with strong systems-integrator or reseller relationships is playing a different, often slower-to-attack game than a pure direct-sales competitor.

This is also the step where you validate (or kill) assumptions from the messaging teardown. Marketing might assume a competitor’s weakness is technical depth; sales might tell you their reps overcome that in every call with a strong technical AE. Don’t publish an insight from Step 4 as fact until it’s cross-checked against Step 7.

Step 8: Synthesize Into Decisions, Not a Binder

This is the step that separates analysis from shelfware, and it’s the one every generic guide skips because it’s the hardest to templatize. For every insight generated in Steps 1–7, force it through one question: what does this change?

Build the output as a short action table, not a narrative deck:

Insight Source Owner Action By when
Competitor A gates integrations behind Enterprise tier Pricing teardown, Step 5 Product marketing Add “no integration fees” to comparison page and battlecard This sprint
Reps have no counter for “they’ve been around longer” objection Sales interviews, Step 7 Sales enablement Build objection-handling one-pager with 3 proof points 2 weeks
Competitor B ranks for 14 mid-funnel terms we don’t touch SEO gap, Step 6 Content 6 briefs prioritized for Q3 This quarter
All 4 direct competitors are silent on compliance/security SWOT roll-up, Step 3 Marketing + Product Test a security-led landing page and one paid campaign Next sprint

Everything without an owner and a date gets cut from the final deliverable. If it doesn’t have both, it’s not actionable yet — park it in a backlog, don’t dilute the document with it.

The AI-Assisted Competitor Research Workflow (What Nobody Else Covers)

Every existing guide on this topic was written for a manual research process — a person opening 15 browser tabs and copy-pasting into a spreadsheet for two weeks. That’s no longer how this work should get done, and it’s the biggest gap in every piece of content currently ranking for this topic.

We treat AI the way we treat every tool in a marketing stack: as a way to compress real work, not as a headline feature. Here’s the actual workflow we run.

Research compression. Feed an LLM the URLs of a competitor’s homepage, pricing page, and top 3 case studies, and ask it to extract the messaging architecture: category claim, primary value prop, supporting proof points, target persona signals, and tone. This turns a 45-minute manual read-through per competitor into a 5-minute review-and-correct pass. The AI won’t get the judgment calls right — that’s still your job — but it will get the extraction right, which is the time-consuming part.

Structured comparison at scale. Once you’ve extracted the same fields for 5–8 competitors, ask the model to build the side-by-side grid from Step 4 automatically. This is where AI genuinely outperforms a human doing it manually — it won’t get bored or sloppy on competitor #7 the way a person doing this for the fourth hour in a row will.

Review-text mining. Pull the last 100–200 reviews for each direct competitor from G2, Capterra, or TrustRadius (export or scrape where terms of service allow), and have an LLM cluster the negative reviews by theme. This surfaces real, buyer-voiced weaknesses — “support is slow,” “onboarding took 3 months,” “pricing jumped after year one” — far faster and more comprehensively than manually skimming reviews, and it’s the single best source of unfiltered, unfiltered-by-marketing competitor weakness in the entire process.

Hiring Signals and Job Postings

Ask an AI research workflow (or an agent-based tool if your stack supports it) to periodically pull and summarize a competitor’s open roles. A sudden wave of “AI Engineer” or “Vertical Solutions — MedTech” postings tells you where they’re about to invest before it shows up in their marketing. This is the emerging-competitor watch list from Step 1 running on autopilot instead of a quarterly manual check.

Draft, Then Verify — Never Auto-Publish

This is the discipline that separates AI-integrated marketing from AI-generated marketing, and it’s non-negotiable in competitive intelligence specifically: every AI-extracted claim about pricing, positioning, or product capability gets verified against the source before it goes into a battlecard or a deck. AI is exceptional at compression and pattern-finding across large volumes of text; it will also confidently hallucinate a pricing tier that doesn’t exist if you let it. Use it to do the first 80% of the reading in a fraction of the time, and spend the time you saved on the judgment calls a machine can’t make — which competitor weakness is actually exploitable, which is just noise.

Standing monitoring, not a one-time pull. Set up a lightweight recurring workflow (a scheduled prompt, a Zapier/Make automation feeding a doc, or an agent with scheduled tool calls) that re-runs the extraction on each competitor’s key pages monthly and flags diffs — a new pricing tier, a rewritten headline, a new case study vertical. This is what actually solves the “analysis goes stale in a quarter” problem from the start of this guide, and it’s genuinely new — nobody else covers this because most agencies still treat AI as a content-generation tool instead of a research and monitoring one.

The point of all of this isn’t “use AI because it’s 2026.” It’s that competitor analysis has always failed for the same two reasons — it takes too long to do properly, and it goes stale the moment it’s done. AI directly solves both, if you build the workflow around verification instead of blind automation.

The B2B Competitor Analysis Tool Stack: A Real Comparison

Most existing guides list the same five tools that have appeared in every “best competitor analysis tools” post since 2019, several of which have been sunset, rebranded, or gone paid-only. Here’s a current, honest comparison organized by what each tool is actually good for — not a ranked “best overall” list, because the right stack depends on what you’re analyzing.

Tools for Research and Signal Collection

Category Tool What it’s actually good for Where it falls short
SEO & content gap Semrush Keyword gap, backlink analysis, position tracking against named competitors — the backbone of Step 6 Traffic estimates are directional, not exact; smaller/niche B2B sites can be under-indexed
SEO & content gap Ahrefs Best-in-class backlink data; strong content gap tool Pricier at scale; steeper learning curve for non-SEO users
Review mining G2 / Capterra / TrustRadius Unfiltered buyer language, especially in negative reviews — critical for Step 3 and the AI review-mining workflow Review volume skews toward mid-market SaaS; thin coverage for industrial/technical B2B vendors
Website change tracking Visualping / Wayback Machine Free or near-free way to track pricing page and homepage changes over time Manual setup per competitor; no analysis, just raw diffs
Firmographic & hiring signals LinkedIn (Sales Navigator) + job boards Headcount trends, hiring signals, exec moves — feeds Step 1’s emerging-competitor watch list Requires manual interpretation; no direct export for analysis

Tools for Intelligence, Synthesis and Monitoring

Category Tool What it’s actually good for Where it falls short
Ad intelligence Meta Ad Library / LinkedIn Ad Library Free, direct look at a competitor’s live paid messaging and creative LinkedIn’s library is thinner than Meta’s; doesn’t cover search ads
Deal-level intel Your own CRM (win/loss fields) The single highest-signal source in this entire framework — real deals, real objections Only as good as your reps’ logging discipline; needs a process, not a tool
Synthesis & monitoring An LLM workflow (ChatGPT/Claude + a scheduled automation) Compression, extraction, clustering, and recurring monitoring — see the AI workflow above Requires a verification step; not a substitute for judgment
Visitor/intent tracking Leadfeeder, Clearbit Reveal, similar Useful for identifying which named accounts are researching competitors alongside you Vendor-specific bias — most of these tools’ own “competitor analysis” content exists to sell this feature, so treat it as one input, not the framework

The pattern worth noticing: no single tool does this job. Every existing guide that leads with a tool comparison is implicitly pitching you a subscription. The right stack is 2–3 paid tools (typically an SEO platform and a review-mining source) plus free tools and your own CRM data, tied together by the AI workflow above — not a single all-in-one platform.

The Template: Copy This Structure

This is the actual document structure we use. It’s built to be filled in over 1–2 weeks by one or two people, not a month-long committee project, and every section maps directly to a step above.

1. Competitor Map

  • Direct (3–6): [names]
  • Indirect (2–4): [names, including “status quo/manual” and “build vs. buy”]
  • Aspirational (2–3): [names]
  • Emerging/watch list (2–4): [names + why they’re on the list]

2. Per-Competitor Profile (repeat for each direct competitor; abbreviated for others)

  • Snapshot: founded, funding/ownership, headcount estimate, HQ/geo focus
  • Positioning: category claim, headline, 3 supporting proof points (verbatim quotes)
  • Product: feature comparison grid (Have / Partial / Don’t have, vs. you)
  • Packaging & pricing: tiers, what’s gated, contract terms, list vs. street price if known
  • Content & SEO: top 10 keywords they own that you don’t, content cadence, format strengths
  • Sales motion: sales-led/PLG/hybrid, typical cycle length, objection patterns from your reps
  • Proof & brand: review site rating + top 3 recurring complaint themes, case study depth
  • Signals: recent funding/leadership news, notable job postings, product launches in last 90 days

3. SWOT (per competitor, with source citations)

  • Strengths: [claim] — Source: [where this came from]
  • Weaknesses: [claim] — Source: [where this came from]
  • Opportunities (derived from S/W above): [what this means for us]
  • Threats (derived from S/W above): [what this means for us]

4. Pattern Roll-Up

  • What’s true across 3+ competitors (category-wide strength/weakness, not competitor-specific)
  • The white space: what nobody in the category is saying or doing

Template Sections 5 to 7: Actions, Battlecards, Cadence

  • Insight | Source | Owner | Action | Deadline (as shown in Step 8)

6. Battlecard Extract (the sales-facing summary — one page, per top 2–3 competitors)

  • One-line “how we win” statement
  • Top 3 differentiators to lead with
  • Top 3 objections and the counter for each
  • Landmines to avoid (where they’re genuinely stronger — don’t compete there, redirect)

7. Review Cadence

  • Full refresh: [quarterly / semi-annually — set a real date, put it on a calendar]
  • Light monitoring: [monthly automated check per the AI workflow above]
  • Trigger-based refresh: [funding round, major product launch, new competitor entering the space]

Copy this structure into a doc, assign sections to owners, and set a deadline. The template is not the deliverable — the completed action table and battlecard are.

Worked Example: Competitor Analysis for an Industrial Sensor Manufacturer

To make this concrete, here’s a worked illustration — a composite built from the kind of engagements we run, not a single named account. The company and the competitor details are representative, not a specific client. It plays out for an industrial B2B manufacturer of process sensors selling into manufacturing and process industries, competing for budget against both established industrial players and a wave of newer, software-forward entrants.

Step 1 — Competitor map:

  • Direct: two legacy sensor manufacturers with decades of channel relationships, one newer IoT-forward entrant
  • Indirect: in-house instrumentation teams building custom solutions; distributors bundling a “good enough” sensor with a larger equipment sale
  • Aspirational: a well-funded industrial IoT platform company customers compare them to on software UX, despite not competing on hardware
  • Emerging: a new entrant with recent funding and three “Applications Engineer — AI/Predictive Maintenance” job postings in the last quarter

Step 4 — Messaging teardown finding: Both legacy competitors lead with reliability and decades-in-business credibility (“trusted since 1987,” “installed in over 40,000 facilities”). Neither says a single word about data integration, predictive maintenance, or software — despite manufacturing buyers increasingly asking about exactly that during evaluation, per the client’s own sales team.

Step 3 — SWOT-derived opportunity: This silence is a category-wide weakness (true across both legacy direct competitors, not just one), which makes it a genuine white-space opportunity rather than a one-off differentiator. The client can credibly own “reliability plus data” positioning while the legacy players stay anchored purely to hardware trust.

The SEO Gap and the Sales Check

Neither legacy competitor ranks for any terms combining their product category with “predictive maintenance,” “AI,” or “data integration” — despite decent overall domain authority from decades of technical documentation. This is exactly the kind of gap an existing but underused content asset (in this case, the client’s own technical documentation and application notes) can be repurposed to close fast, rather than starting content from zero.

Step 7 — Sales validation: Interviews with the client’s field sales engineers confirmed the finding — reps report that plant engineers increasingly ask about data output and integration during the technical evaluation stage, and that neither legacy competitor’s sales team has a strong answer. This cross-check (per Step 8’s discipline) turned a marketing hypothesis into a validated, sales-confirmed opportunity before a dollar was spent building a campaign around it.

Action table output:

Insight Owner Action
Category-wide silence on data/predictive maintenance Marketing New landing page + 4 application-note-style articles positioning “reliability + data,” reusing existing technical documentation
No reps have a data-integration talk track Sales enablement One-page battlecard section, built directly from field engineer interviews
Emerging competitor hiring AI/predictive maintenance engineers Leadership Quarterly watch-list check-in; no action yet, but flagged

This example is deliberately industrial, not SaaS — because almost every published guide on this topic assumes a software buyer, a self-serve trial, and a G2 review page. Industrial and technical B2B buyers research and buy differently, and the next section covers why that matters for how you should actually run this process in that world.

Competitor Analysis for Industrial and MedTech B2B (The Vertical Nobody Serves)

Every piece of content currently ranking for “b2b competitor analysis” — the templates, the tool lists, the step-by-step guides — is written with an implicit assumption: your competitors have public pricing pages, a G2 profile with hundreds of reviews, and a self-serve or short-cycle sales motion. That’s the SaaS default, and it’s simply wrong for a huge and underserved segment of B2B: industrial manufacturers, medtech companies, and technical B2B vendors selling capital equipment, components, or regulated products.

If that’s your world, here’s what actually changes:

Public pricing rarely exists. Most industrial and medtech competitors quote per-deal, per-configuration, or through distributors, so the pricing teardown in Step 5 has to lean almost entirely on your own sales team’s quote history and distributor conversations — not a pricing page.

Review sites are thin or absent. G2 and Capterra are built for software buyers. A process sensor, an industrial pump, or a Class II medical device won’t have 200 reviews to mine for weakness signals. Instead, the equivalent sources are: trade publication comparisons, conference presence and speaker slots, distributor and rep network overlap, and — critically — technical forums and standards-body discussion groups where engineers actually talk shop. This is slower and more manual than pulling a G2 export, but the signal, once you find it, is often higher quality because it’s unfiltered technical opinion rather than a marketing-solicited review.

The buying committee is technical, not just commercial. A messaging teardown that only looks at the homepage misses where the real evaluation happens: datasheets, application notes, technical specifications, and certifications (ISO, FDA clearance class, IP rating, hazardous-location ratings). An industrial or medtech competitor’s true positioning often lives in a PDF datasheet, not a hero headline — and that’s exactly the kind of document most competitor-analysis processes never think to pull.

Compliance and Certification as Competitive Intelligence

Which standards a competitor is certified against, which regulatory pathway they took (510(k) vs. De Novo in medtech, for example), and which industry-specific approvals they hold aren’t just product facts — they’re market-access signals that tell you where they can and can’t sell, and where a gap in their certification is a real, defensible opportunity for you.

SEO Gap Analysis in Regulated Categories

This is genuinely good news: industrial and technical B2B search volume is lower than SaaS, but so is content investment from most incumbents. Long-established industrial manufacturers frequently have decades of technical documentation and application notes sitting on their site with almost no SEO structure, meta content, or internal linking around it — meaning a competitor with even modest, deliberate content investment can out-rank a much larger, better-known incumbent surprisingly fast. If you already have technical documentation, application notes, or engineering content living on your site, that’s an underused asset, not a starting-from-zero content gap.

AI-assisted research is disproportionately valuable here, not less. Because public data is thinner, the AI workflow described earlier — extracting and clustering signal from trade publications, technical forums, distributor sites, and job postings — does more relative work in industrial and medtech than it does in SaaS, where a lot of that intelligence is already sitting in a tidy G2 review. If your research process is still “check their pricing page and their homepage,” you’re using a SaaS-built process on a market that doesn’t work that way — and it will produce a thin, generic analysis regardless of how much time you put into it.

We built this framework the same way we approach every client engagement at StepUp: as a full-stack execution problem, not a research-only exercise, and increasingly for exactly this kind of buyer — industrial and medtech B2B companies that need real marketing execution and a genuinely AI-integrated marketing partner, not another advisory deck.

How Often to Redo Your Competitor Analysis

The honest answer is: never redo it from zero. Refresh it.

  • Light monitoring — monthly. The AI-assisted monitoring workflow (pricing/homepage diffs, new job postings, new reviews) runs continuously with minimal effort once it’s set up. This is what prevents the “stale in a quarter” problem entirely.
  • Targeted refresh — trigger-based. A competitor raises funding, launches a major product, gets acquired, or repositions — refresh just their profile immediately, not the whole document.
  • Full refresh — quarterly for fast-moving categories, semi-annually for slower ones. Industrial and medtech categories generally move slower than SaaS; a semi-annual full refresh is usually sufficient unless a specific trigger event happens sooner.
  • Battlecard refresh — every sales kickoff/QBR cycle, pulled directly from the latest win/loss data, regardless of whether the full analysis has been refreshed.

Put these dates on a shared calendar with an owner attached. A competitor analysis without a scheduled refresh date is, by definition, already decaying the day it’s finished.

Common Mistakes That Turn Analysis Into Shelfware

Doing it once a year as a standalone project. Competitive intelligence is a system, not a project. If it only exists as an annual offsite exercise, it’s stale for eleven of the twelve months.

Letting marketing build it in isolation from sales. The richest, most current competitive intelligence in your company is sitting in your sales team’s heads and your CRM’s closed-lost notes. A competitor analysis built without Step 7’s sales interviews is missing the highest-signal input available.

Confusing “comprehensive” with “useful.” A 40-page document that covers everything and prioritizes nothing is harder to act on than a tight action table. Depth belongs in the research process; the deliverable should be short.

No owner, no deadline, no follow-up. Every insight needs an owner and a date, or it doesn’t make it into the final document — full stop. This is the single biggest reason competitor analyses become shelfware, and it’s also the easiest one to fix.

Treating AI output as verified fact. The efficiency gains from an AI-assisted workflow are real, but every pricing, positioning, or capability claim it extracts needs a human check against the source before it lands in a battlecard your sales team will repeat in a live deal.

Using a SaaS-built process on a non-SaaS market. If your buyer isn’t reading G2 reviews and comparing self-serve pricing tiers, your research process shouldn’t assume they are. This is the mistake nearly every existing guide on this topic makes by default.

Frequently Asked Questions

How is B2B competitor analysis different from B2C?

B2B buying decisions involve a committee, longer cycles, and technical/commercial evaluation criteria that rarely show up on a public pricing page — so the research has to lean much more heavily on sales intelligence (win/loss data, rep interviews) and less on consumer-style review mining or social listening.

What’s the difference between a competitive analysis and a battlecard?

The competitive analysis is the full research process and document (Steps 1–7 above); the battlecard is the one-page, sales-facing distillation of it — the “how we win” summary your reps actually use in a live deal. You need both, but they’re not the same deliverable, and a battlecard is what actually gets used day to day.

How many competitors should I actually analyze in depth?

Full-depth profiles (the complete matrix from Step 2) for your 3–5 direct competitors. Lighter profiles for indirect and aspirational competitors. A short watch-list entry for emerging ones. Depth should track deal impact, not curiosity.

Do I need expensive tools to do this well?

No. The highest-signal input in this entire framework — your own CRM win/loss data and sales team interviews — is free. Paid tools (an SEO platform, a review-mining source) make the process faster and the content gap analysis sharper, but a rigorous manual process with free tools will still outperform a shallow, tool-heavy one.

How is this different from a SWOT analysis?

SWOT is one component within a full competitor analysis (Step 3), not a replacement for it. A standalone SWOT without the underlying research matrix, messaging teardown, and sales validation tends to produce generic, unsourced claims — which is exactly the trap this guide is built to avoid.

Turning This Into a Commercial Advantage, Not a Binder

The gap between a competitor analysis that sits in a shared drive and one that actually changes your win rate isn’t research depth — it’s execution discipline. The framework above works because every step produces something a real team can use this week: a messaging teardown that feeds a positioning workshop, a content gap that becomes a briefs backlog, a sales interview that becomes a battlecard, an AI monitoring workflow that keeps all of it current without another two-week research sprint next quarter.

That’s the same principle behind everything we build at StepUp: This work should produce decisions and deliverables, not decks. If you’re an industrial, medtech, or technical B2B company that needs a real marketing execution partner — one that treats AI as an actual working tool inside the process, not a marketing headline — that’s exactly the kind of engagement we run. Talk to us about what a live competitor analysis and marketing plan would look like for your category.

MQL vs SQL: How to Fix the Lead Handoff Between Marketing and Sales

Most B2B companies do not have a lead quality problem. They have a definition problem that looks like a lead quality problem.

Marketing sends what it believes are qualified leads. Sales works a few, decides the rest are junk, and stops trusting the queue. Marketing sees leads going untouched and concludes sales is lazy. Both teams are looking at the same records and reading them completely differently, because nobody wrote down what “qualified” means.

Forrester has put the average B2B lead acceptance rate at around 42%. More than half of what marketing hands over is never properly worked. That is not a volume problem you can spend your way out of. It is a handoff problem, and it is fixable in about two weeks.

Here is the difference between an MQL and an SQL, and the five things that make the handoff between them actually work.

MQL vs SQL: what is the difference?

A Marketing Qualified Lead (MQL) has shown enough interest to be worth marketing’s continued attention. A Sales Qualified Lead (SQL) has shown enough intent and fit to be worth a salesperson’s time.

The distinction is not seniority or company size. It is what the lead has demonstrated:

MQL SQL
What it signals Interest — they are paying attention Intent — they are evaluating a purchase
Evidence Content engagement, repeat visits, email response Demo request, pricing enquiry, stated timeline, budget signals
Who owns it Marketing Sales
Next action Nurture, educate, qualify further Direct contact, discovery call
Failure mode Passed to sales too early and burned Left in nurture and lost to a competitor

An MQL understands your product and is interested in it, but is not ready to buy. An SQL has shown real intent and needs a conversation, not another whitepaper.

Why the distinction breaks down in practice

Three things go wrong, and they go wrong at almost every company:

Interest gets mistaken for intent. Somebody downloads a report and hits an MQL score threshold. Nothing about that download says they intend to buy anything. Scoring models that count activity without weighting type of activity produce exactly this.

Fit gets ignored entirely. A perfect-fit company showing moderate interest is worth far more than a wrong-fit company showing high interest. Most scoring models reward the second and miss the first.

The threshold is arbitrary. Somebody picked 100 points in a meeting three years ago. Nobody has checked since whether leads crossing 100 actually close at a better rate than leads at 80.

The five essentials of an MQL to SQL handoff that works

Marketing owns the alignment here. Not because it is marketing’s fault, but because marketing controls the definitions, the data, and the moment of transfer.

1. Establish shared lead definitions

The definition of a qualified lead is the single biggest source of conflict between marketing and sales, so settle it first.

Get marketing, sales, and whoever owns revenue in one room and write down, in plain language, what makes a lead an MQL and what makes it an SQL. Not a score — the actual criteria. Then have both leaders sign it.

The test of a real definition is whether two people, given the same lead record, independently assign the same stage. If they cannot, the definition is not finished.

2. Build the vocabulary and the SLA

Sales evaluates incoming leads on two axes: fit — how well you can serve them — and interest — how much of a priority you are to them. Marketing is responsible for defining lifecycle stages against those two axes, creating the lead categories, and documenting how each is handled.

That document is a Service Level Agreement, and it needs to be genuinely bilateral:

  • Marketing commits to a volume of MQLs meeting the agreed definition, with required fields populated.
  • Sales commits to working every accepted lead within a defined window, and to recording a disposition reason for every rejection.

That second commitment is the one people skip, and it is the one that makes the system learn. Without a structured rejection reason, you never find out why half the leads are being dropped.

3. Document the handoff properly

Leads slip because the information does not travel with them. A rep opens a record, sees a name and a company, and starts the conversation from zero — when marketing already knew what the lead read, what problem they searched for, and which competitor they compared.

Define the minimum record that must accompany every handoff: source, the content or campaign that drove engagement, the problem indicated, relevant firmographics, and any stated timeline. Make the fields required rather than optional. Optional fields do not get filled.

4. Get the timing right

Speed is the highest-leverage variable in the entire handoff, and the cheapest to fix.

The working standard is contact within 24 hours of qualification, and faster for high-intent actions. A demo request should be answered in minutes, not the following morning. Intent decays — the person who requested a demo at 10am is comparing three vendors by lunch.

If you fix nothing else on this list, measure your median time from qualification to first contact. It is usually far worse than anyone believes, and it is usually a routing problem, not an effort problem.

5. Keep marketing in the room early

Most B2B purchases require a relationship before conversion. Marketing has often already built one — through content, through email, through months of low-grade familiarity.

Keeping a marketer in the first sales conversation makes the transition feel like a continuation rather than a handoff to a stranger. It also gives marketing direct exposure to how buyers actually describe their problem, which is worth more than any amount of survey data.

What to measure once the definitions are fixed

Definitions are only half the work. Without instrumentation you cannot tell whether the new definitions are better than the old ones, so agree these five numbers at the same meeting where you agree the definitions.

Metric What it tells you Healthy signal What it means when it slips
Lead acceptance rate Share of MQLs sales actually works Above 70% Your MQL definition is letting the wrong leads through
Median time to first contact How fast qualification turns into a conversation Under 24 hours; minutes for demo requests A routing problem, almost never an effort problem
MQL to SQL conversion rate Whether interest is turning into intent Stable or rising quarter on quarter Nurture is not moving people, or the threshold is set too low
Rejection reasons, grouped Why sales is dropping leads Two or three reasons, each shrinking Nobody is recording dispositions, so nothing is learning
SQL to opportunity rate Whether sales agrees with its own definition Consistent across reps Reps are applying the SQL definition differently

Review all five together, monthly, with both teams in the room. Looked at individually they mislead: acceptance rate rises trivially if marketing simply sends fewer leads, and conversion rate rises if sales quietly stops accepting anything marginal. Read as a set, however, they tell you whether the handoff is genuinely improving.

The one to watch first is lead acceptance rate. It is the closest thing to a single measure of whether the two teams are describing the same thing when they say “qualified.”

A worked example: what the arithmetic looks like

The numbers below are illustrative rather than a specific client, but the shape of them is what an audit of this kind usually finds.

Take a mid-market industrial supplier where leadership has called the problem a lead quality crisis. Marketing reports 180 MQLs a quarter. Sales reports that “almost none of them are real.” Both are telling the truth as they see it.

Pull the records and the picture resolves. Of those 180, sales contacted 71 — roughly 39%, close to the Forrester figure above. Of the 109 never worked, the reasons cluster into three groups:

  • Wrong company size. Around half are sub-25-employee firms that cannot meet the minimum order quantity. No size field is required on the form, so this stays invisible until a rep opens the record.
  • No stated problem. A second group downloaded a single top-of-funnel guide and hit the score threshold on page views alone. Nothing indicates what they are trying to solve.
  • Existing customers. A smaller group are contacts at accounts the company already serves, re-entering through the website and being scored as new.

None of that is a lead quality problem. Each one is a definition or a data problem, and all three are fixable inside a fortnight.

What actually gets changed

The fixes are unglamorous. Company size becomes a required form field and a hard disqualifier below the threshold. The score model is reweighted so that a single downloaded asset can no longer, by itself, cross the MQL line — some evidence of a stated problem becomes mandatory. Existing accounts are suppressed from the MQL queue and routed to account management instead.

Then volume drops. Marketing reports 96 MQLs the following quarter instead of 180, which feels like a loss until the second number arrives: sales works 78 of them. Acceptance moves from 39% to 81%, and the number of leads actually contacted rises from 71 to 78 — more real conversations, from barely half the reported volume.

That pattern is the normal outcome. Fixing the definitions almost always reduces reported MQL volume and increases the amount of genuine sales activity. If your MQL number is a target somebody is measured on, agree in advance that it is expected to fall.

How AI changes lead qualification in 2026

The five essentials above have been true for a decade. What has changed is that the expensive parts are no longer expensive.

Qualification stops being a score and becomes a judgement. Point-based scoring was always a workaround — a crude proxy because reading every lead record by hand did not scale. It does now. An agent with your ICP definition, your won/lost history, and your product constraints can assess fit and intent on each lead individually and explain its reasoning in a sentence a rep can read.

The important part is the explanation. A score of 87 tells a rep nothing. “Manufacturing, 200 employees, viewed pricing twice this week, their current vendor was just acquired” tells them how to open the call.

The definitions become a living document. The hardest part of the SLA has always been maintaining it. Nobody revisits qualification criteria quarterly because it means a painful meeting and a data pull nobody has time for. When rejection reasons are captured in a structured way, that analysis runs continuously — and the criteria get corrected from evidence instead of from opinion.

Two warnings. First, this only works if the ICP definition is genuinely written down. An agent working from a vague ideal customer profile produces confidently wrong qualification, faster and at greater volume. The system amplifies your definition — so the definition has to be right. Second, automating the handoff without fixing the definitions just industrialises the existing disagreement. Fix the definitions first, then automate.

This is the difference between AI-decorated and AI-integrated operations. Decorated is a scoring model with a machine-learning label on it. Integrated is a qualification process that improves every week because it is learning from what sales actually accepted and closed.

How to fix your handoff in two weeks

Week one — establish the truth. Pull every lead marketing passed to sales in the last quarter — the same exercise a full marketing audit starts with. Calculate what percentage sales actually worked, and what percentage of those became opportunities. Then take the twenty most recent rejected leads and find out, individually, why each was rejected. You will almost always find two or three recurring reasons that account for most of the rejections.

Week two — rewrite and commit. Sit both teams down with those reasons. Rewrite the MQL and SQL definitions so the recurring rejection reasons are screened out before handoff. Agree the SLA in both directions. Make the required handoff fields mandatory in your CRM. Set the response-time standard and instrument it.

Then review the same numbers in thirty days. Acceptance rate is the metric that tells you whether the definitions are working.

Frequently asked questions

What does MQL stand for?

Marketing Qualified Lead — a lead that has engaged enough with marketing to warrant continued attention, but has not yet demonstrated buying intent.

What does SQL stand for in marketing?

Sales Qualified Lead — a lead that has shown enough intent and fit that a salesperson should contact them directly. In a marketing context it has nothing to do with the database query language of the same abbreviation.

What is the difference between an MQL and an SQL?

An MQL has shown interest; an SQL has shown intent. Interest means they are paying attention to you. Intent means they are actively evaluating a purchase. The MQL belongs to marketing, the SQL belongs to sales.

Who decides when an MQL becomes an SQL?

Both teams, in advance, in writing. If sales alone decides, marketing has no target to work toward. If marketing alone decides, sales will not trust the queue. The definition should be agreed jointly and reviewed quarterly.

What is a good MQL to SQL conversion rate?

It varies widely by category and deal size, so external benchmarks are of limited use. What matters more is your lead acceptance rate — the share of MQLs sales actually works. If that is below roughly half, your definition is wrong, regardless of what any benchmark says.

Should we use lead scoring at all?

Scoring is a useful triage signal and a poor decision-maker. Use it to prioritise, not to qualify. And check at least once a year whether leads above your threshold genuinely close at a higher rate than leads just below it — often they do not.

How long should a lead stay an MQL before it is recycled?

Set an explicit expiry rather than letting records sit indefinitely. A common working rule is 90 days: if an MQL has not progressed to SQL in that window, it returns to nurture with its score reset. Otherwise your MQL pool slowly fills with contacts who looked interested two years ago.

Should marketing be measured on MQLs or on pipeline?

On pipeline, with MQLs as a diagnostic rather than a goal. The moment MQL volume becomes the number marketing is judged on, the definition starts drifting to make the number easier to hit — which is how most companies arrive at the problem in the first place.

What is an SQL versus an SAL?

Some organisations add Sales Accepted Lead (SAL) between MQL and SQL: marketing passes an MQL, sales formally accepts it as an SAL, and it becomes an SQL once discovery confirms fit and intent. The extra stage is worth adding only if you need to measure acceptance separately from qualification.

The short version

MQL and SQL are not scoring tiers. They mark the boundary between interest and intent, and between two teams that need to agree on where that boundary sits.

Write the definitions down. Commit to both sides of the SLA. Make the handoff record mandatory. Answer fast. Capture why leads get rejected, and let that evidence correct the definitions.

The companies that get this right are not generating better leads than you. They have simply agreed what a lead is.

StepUp builds and runs AI-integrated marketing operations for global B2B companies — including the qualification systems that make the marketing-to-sales handoff work. Let’s talk about where your handoff is leaking.

The One-Page Marketing Plan for B2B: Framework, Template, and a Worked Example

This one-page marketing plan guide was originally published February 2020. Updated September 2026.

A one-page marketing plan exists for one reason: most marketing plans get read exactly twice. Once when they’re presented, once when someone digs them out of the shared drive to prove a point in an argument. In between, nothing.

That isn’t a thinking problem. It’s a format problem. Nobody opens a forty-slide deck on a Tuesday morning to decide what to do next.

A one-page marketing plan, by contrast, is built for Tuesday morning. It forces every real decision — who you’re selling to, why they choose you, what you’re doing about it, and how you’ll know it worked — onto a single page you can pin above a desk, open in a weekly meeting, or hand to a new hire on their first day. If it doesn’t fit on one page, it isn’t a plan. It’s a wish list with formatting.

This guide gives you the framework, a fill-in template you can copy into a doc in the next five minutes, and a fully worked example for a B2B software company. Not a bakery, not a food truck, not the coffee shop every other guide recycles. It also covers the part almost nobody writes about: how to keep the page accurate after week four, when reality has moved and the plan on the wall hasn’t.

What Is a One-Page Marketing Plan?

A one-page marketing plan is a single-page document holding your entire marketing approach: target audience, positioning, goals, channels, budget, metrics, timeline, and owners.

It is not a summary of a longer plan. It is the plan. Anything that can’t earn a line on the page gets cut, and the cutting is the useful part. If a decision can’t survive being written in one sentence, it usually isn’t a decision yet. It’s a placeholder for one nobody has made.

The format comes from Allan Dib’s book of almost the same name, which popularised a nine-square grid for small businesses: Before, During, and After the sale. It’s a sound mental model for solo operators and local businesses, and his own site is still the best place to see the original nine-square grid. It was never built for companies with six-month sales cycles, four people on the buying committee, and a marketing team that has to coordinate content, paid, product marketing, and sales support against a single number.

That’s the gap this guide fills. The discipline of the original, rebuilt for how B2B revenue actually works.

Why B2B Teams Need a One-Page Marketing Plan

Long strategy decks fail for a structural reason, not a quality one. Admittedly, they’re built to win the budget conversation, and they’re very good at that. Then the budget is approved, the deck is filed, and the team goes back to running whatever it was already running. The deck never told anyone what to do on Monday.

A one-page marketing plan is optimised for the opposite moment: the ordinary week. It has three properties a deck doesn’t.

It’s legible in under two minutes. Anyone on the team, including a new salesperson in their first week, can look at it and know the target account, the message, and this quarter’s number without a briefing.

It forces a priority order. A deck can hold five strategic pillars and twelve key initiatives without anyone noticing there’s no order to them. Meanwhile, a page has room for three or four channels done properly. That constraint is the whole point.

It’s cheap to update. Because it’s short, revising it isn’t a project. You can change it in a Monday meeting, which matters, because target accounts and channel performance move faster than an annual planning cycle admits.

The one-page marketing plan isn’t a stylistic preference. It’s an execution discipline. The companies that actually hit their numbers treat the plan as an operating document the whole team references weekly, not a strategy artifact revisited once a year.

Before You Write Your One-Page Marketing Plan: Four Decisions

The page is short, which fools people into thinking it’s quick. It isn’t. The page is the output of four decisions, and if any of them are still open, you’ll feel it immediately: the section reads vague, and no amount of rewriting fixes it, because the vagueness is in the thinking, not the sentence.

Who you actually sell to. Not the market category. The specific profile of a company that buys, uses, and renews. If that work isn’t done, start with what an ICP is and how to build one, then come back.

How big that group really is. A plan aimed at a segment too small to carry the number is a plan that fails on arithmetic, not execution. Sizing the addressable market is a one-afternoon exercise that saves a quarter.

What the alternatives look like to your buyer. Your positioning is a claim about a choice they’re making between you and someone else, and you can’t write it without knowing what the someone else says. A structured look at the competitive set gives you the language to write against.

What’s already working and what isn’t. Most teams have more evidence than they use. A short audit of current marketing tells you which channels have earned another quarter of budget and which have been coasting on habit.

Have those four, and the page takes an hour. Skip them, and you’ll produce a page that looks like a plan and behaves like a poster.

The Anatomy of a B2B One-Page Marketing Plan

Every one-page marketing plan that works answers eight questions, in this order, because each one depends on the answer before it.

  1. Who exactly are we selling to? (Target audience)
  2. Why do they choose us over the alternatives? (Unique value proposition)
  3. What does winning look like this period? (Goals)
  4. Where do we reach them, and what do we do there? (Channels and tactics)
  5. What can we spend, and where does it go? (Budget)
  6. How will we know it’s working before the quarter ends? (Metrics)
  7. When does each piece happen? (Timeline)
  8. Who’s accountable, and how does this stay current? (Ownership and review)

Skip one and the plan collapses somewhere further down. Teams that skip the first end up with messaging that could belong to any vendor in the category. Teams that skip the sixth don’t discover the plan failed until the quarterly review, when the money is already spent. The order matters as much as the content.

Here’s what belongs in each section, and what to leave out.

1. Target Audience

This is the section most plans get wrong, and everything downstream depends on it. Certainly “mid-market software companies” is not an audience. It’s a category containing thousands of businesses, most of which will never buy from you.

The page needs a definition tight enough that anyone on the team can look at a company and answer yes or no in five seconds. That means four lines:

  • Firmographics. Employee range, revenue band, vertical, and the parts of the technology stack that matter.
  • The buying committee. Who starts the evaluation, who can veto it, who signs.
  • The trigger. What has to have happened in their business for this to become urgent rather than interesting.
  • The disqualifier. Who looks like a fit on paper and isn’t, and why.

That last line is the one almost everyone skips, and it’s usually the most valuable sentence on the page. Knowing who you don’t sell to is what stops the content team producing material that technically applies to everyone and moves no one.

Three or four lines, no more. If describing your target account takes a paragraph, the work isn’t finished. You’ve moved the vagueness from the category into the description. When you’re ready to tighten it properly, the practical build guide for an ideal customer profile walks through the evidence to use.

2. Unique Value Proposition

Your value proposition is the one sentence explaining why a buyer picks you over the next three names on their shortlist. Not a mission statement, nor a feature list, and certainly not “we help companies grow.”

Here’s the test. Read your sentence out loud, then read your closest competitor’s homepage headline out loud. If they’re interchangeable, you don’t have a value proposition. You have category language. Notably, a buyer running an evaluation reads five or six near-identical claims in a morning. The page should force you to write the one that isn’t.

A structure that holds up:

For [specific audience], [company] is the only [category] that [specific mechanism], so [specific outcome], without [the tradeoff the alternatives force].

The last clause is the one most companies leave off, and it’s usually the most persuasive part. Buyers want to know what they get. They’re at least as interested in what they don’t have to give up.

3. Goals

One number. Not five.

The most common failure in this section is a list of awareness, engagement, qualified leads, revenue, and brand health, all presented as equals. They aren’t equals. In a plan that drives decisions, one of them is the number everything else ladders up to, and the rest are diagnostics you watch.

Generally, for most B2B companies that number is sourced revenue or qualified sales opportunities. Not traffic, not leads. Those are activity measures, useful for working out why the plan is off track and useless as the plan’s objective, because a team can hit a lead target and miss revenue by a mile. If the handoff between marketing and sales is where your numbers keep breaking down, the difference between an MQL and an SQL is worth settling before you write this line.

On the page:

  • Primary goal. One number, one timeframe.
  • Two or three supporting measures that show whether the primary is on track before the period ends.
  • The gap. The delta between the current run rate and the goal, and where that delta is supposed to come from.

That gap line is what turns a goal into a plan. “$1.2M in new opportunities” is a wish. “$1.2M in new opportunities, current run rate $700K, the missing $500K comes from paid coverage in the two segments where we’re underspending” is a decision you can argue with.

4. Channels and Tactics

This is where one-page plans go one of two wrong ways: too vague to act on, or too crowded to focus. The fix is the constraint that makes the whole format work. Choose fewer channels than feels comfortable, then say exactly what happens in each one.

Your channels should map to where your buyers actually research, which in B2B is overwhelmingly self-directed. Peer reviews, search, LinkedIn, industry communities, and existing vendor relationships all get used long before anyone talks to a salesperson. The mix should reflect that, not a generic “content, social, email, paid” list inherited from a template.

For each channel, one line with three things:

  • The channel.
  • The specific tactic, not the category. Not “content marketing.” Rather: “a three-part technical comparison series aimed at evaluation-stage searches.”
  • The owner and the cadence.

So a plan with “content marketing” as a line item isn’t a plan. It’s a heading. It tells nobody what to publish next Tuesday. If the distinction between publishing consistently and building a system that compounds is still fuzzy on your team, content marketing versus inbound is a useful hour.

5. Budget

Most guides skip budget entirely or reduce it to “60% content, 40% paid.” That number is meaningless without context. The right split depends on sales cycle length, how much of your audience is already looking, and how much of it you have to reach before it starts looking.

Three lines belong on the page:

  • Total for the period.
  • Split by channel, matching the channels above. By channel, not by department.
  • Fixed versus flexible. How much is committed to tools, retainers, and people, and how much you can move mid-quarter.

That third line is what makes budget a planning tool instead of an accounting record. If ninety per cent of your money is locked up, you have no way to respond when a channel is clearly working or clearly isn’t by week six. Better to know that when you write the plan than to discover it in week ten. For the underlying logic of how much to spend and against what, see how to set a B2B marketing budget.

6. Metrics

Section 3 says what winning looks like at the end. This section says how you’ll know you’re on track during.

Two tiers, and the split matters:

  • Leading indicators, checked weekly or every other week. Target-account engagement, opportunity velocity, conversion on the priority pages, qualified opportunities from named accounts.
  • The lagging indicator, checked at the end. The primary goal itself.

Meanwhile, the trap here is filling the section with numbers that feel like progress and predict nothing. Page views, impressions, and total leads can all rise while revenue stays flat, because none of them know whether the traffic matches the audience defined in section 1. Every measure on this page should trace back to that definition. If it doesn’t, it’s noise with a chart attached.

7. Timeline

A month-by-month view of when each tactic ships, launches, or reports. Not a Gantt chart. Three or four rows.

Month Key activities Milestone
Month 1 Launch the content series, set up paid campaigns First two assets live
Month 2 Adjust based on early conversion data Mid-quarter checkpoint
Month 3 Scale what’s working, stop what isn’t Quarter-end review against the goal

The timeline isn’t there for project management. You have other tools for that. It’s there to put a checkpoint inside the quarter, so a channel that isn’t working gets caught in week six rather than diagnosed in the review after the money is gone.

8. Ownership and Review

One name accountable for the plan. One name per channel line. A tactic with nobody’s name against it doesn’t get done with any urgency, however well it’s written.

Then the cadence: which parts get looked at weekly, when the plan gets revised, and when it gets rebuilt. Write it on the page. A review that lives only in someone’s intention doesn’t happen.

Using AI to Build a One-Page Marketing Plan

Ask a chatbot to write your one-page marketing plan and you’ll get something that looks right and says nothing. Eight tidy sections, category language throughout, an audience definition that would suit any competitor, and a goal with no number in it. That output is not a tool failure. It’s a mirror. The model had nothing specific to work from, so it returned the average of everything it has read.

Used differently, though, AI is genuinely good at three jobs on this page, and they’re the three jobs people are worst at doing alone.

Pressure-testing the audience definition. Give it your section 1 alongside a list of ten companies, five that bought and five that didn’t, and ask which of them your definition would have predicted correctly. This is the fastest way to find out that your criteria describe your customers after the fact and wouldn’t have picked them in advance. Then feed it your closed-lost reasons and ask what disqualifier the pattern suggests. The disqualifier line is the hardest one to write from memory and the easiest to derive from evidence.

Where AI Genuinely Helps

Breaking the value proposition. Paste your sentence in next to the homepage headlines of your four closest competitors, and ask which claims are interchangeable and which are genuinely yours. Then ask the harder question: what would a sceptical buyer need to see to believe the claim. If the answer is proof you don’t have, the sentence isn’t ready, and better to learn that now than in a sales call.

Doing the arithmetic on the gap. Section 3 asks where the missing revenue comes from. That’s a modelling question, and it’s tedious by hand. Give it your current conversion rates by channel, your average deal size, and your cycle length, and have it show what has to be true for each channel to close the gap. Half the time the answer is that the plan requires a conversion rate nobody has ever achieved, which is worth knowing in week one rather than week ten.

What to Keep Away From the Model

What to keep away from it: the narrative. Your positioning, your message, and the way your company sounds are not places to accept an average answer, because average is precisely what makes marketing invisible. Draft those yourself, then use the model to attack them.

The order matters more than the prompt. Bring specifics and it sharpens them. Bring vagueness and it will return the same vagueness, formatted more confidently, and the confidence is the dangerous part.

Keeping the One-Page Marketing Plan Alive After Week Four

Here’s the part every other guide to the one-page marketing plan leaves out, and it’s the reason most one-page plans die the same death as the decks they replaced.

A plan that’s static is already going stale.

The traditional model is that someone builds the plan quarterly and updates it manually, if they remember, at the next review. In practice, “update it manually” loses to everything else on a marketer’s week. By week four the page on the wall and the reality in the business have quietly separated, and nobody has noticed because nobody has checked.

The fix isn’t a better template. It’s treating the page as something a system keeps current, rather than something a person retypes. Three things make that real:

Performance data comes to the plan, not the other way round. Revenue by channel, conversion by segment, engagement on named accounts, pulled from the CRM and analytics and summarised against the goals already written on the page. The weekly check in section 6 should take ten minutes, not half a day of exporting spreadsheets.

Drift gets flagged when it happens. If cost per opportunity doubles in week three, or a channel meant to produce forty per cent of new opportunities is producing twelve, that should surface as a note against the plan that week. Not six weeks later inside a slide someone built for a review.

What a Living Plan Looks Like in Practice

The redraft comes with the alert. The useful version isn’t “channel X is underperforming.” It’s “channel X is underperforming, here’s what moving the flexible spend to channel Y does to the numbers in section 5, here’s the revised page for review.” A person still makes the call. The analysis and the rewrite shouldn’t need a meeting to produce.

This is the difference between AI stuck on top of a marketing plan and AI underneath one. Consequently, the page doesn’t need an artificial intelligence section. It needs the discipline of staying accurate, applied automatically, so the page you wrote in January is still the page your team is running in September rather than a historical document nobody has opened since it was approved.

Worth being blunt about the order of operations, because it’s where most teams get this backwards: none of this works on a plan that was vague to begin with. Automation applied to a clear plan keeps it honest. Automation applied to an unclear one just produces confident-sounding updates about goals nobody agreed on. We’ve written separately about why AI exposes weak marketing rather than fixing it, and the one-page plan is the cleanest illustration of it. The page has nowhere to hide a fuzzy decision.

Your One-Page Marketing Plan in the Room With Your CEO

There’s a use for a one-page marketing plan that has nothing to do with marketing operations, and it’s often the one that matters most.

Marketing underperforms in a lot of companies not because the strategy is wrong but because leadership can’t see what marketing is doing. The work is real, the effort is real, and yet from the CEO’s chair it looks like activity without a shape. That gap is where budgets get cut and where the marketing lead stops being invited to the conversations that decide things.

A one-page marketing plan closes it faster than any dashboard. Three reasons:

It’s short enough to actually get read. A CEO will read one page. They will not read your channel strategy document, and it isn’t a character flaw. They’re making decisions across the whole business, and marketing gets the same few minutes as everything else.

It shows the reasoning, not just the results. The gap line in section 3 and the fixed-versus-flexible split in section 5 tell a leader how you think. That builds far more confidence than a green dashboard, because it shows you know where the plan is fragile.

It makes the plan arguable. This sounds like a drawback and is actually the point. When leadership can see that the number depends on two specific segments and a specific budget split, they can push back on the substance instead of vaguely wanting more. An argument about the plan is a much better meeting than an argument about whether marketing is working.

The Defensive Case for a One-Page Plan

There’s a defensive benefit too. When a leader asks mid-quarter for a campaign that isn’t on the page, you’re not arguing about priorities in the abstract. You have a document showing what the quarter’s money and time are committed to, and the conversation becomes what to trade rather than what to add. Sometimes the answer is genuinely to add it. But the trade gets made deliberately, on the record, rather than absorbed silently by a team that then misses the number.

Companies running this well use the page as the standing first slide of the monthly leadership update. Same page every month, updated numbers, visible drift. After two or three months, leadership starts reading marketing as a system with inputs and outputs rather than a department that produces things. That shift is worth more than any single campaign on the page.

A Fully Worked One-Page Marketing Plan: Meridian Flow

Generic examples are why most one-page marketing plan guides don’t actually help. A bakery’s plan doesn’t translate to a company selling a $32K annual software contract to a VP of Operations who has to get an IT director’s approval.

So here’s a complete plan for an illustrative composite company. The numbers are realistic for its size and market, and they’re meant to be argued with, which is the point of showing them.

Meridian Flow. Workflow automation for manufacturing operations teams. $8M in annual recurring revenue, 45 employees, average contract $32K a year, four to six month sales cycle.


1. Target audience

VPs and Directors of Operations, and Plant Managers, at mid-market discrete manufacturers of 150 to 1,500 employees, currently running production scheduling in spreadsheets or a legacy system with no live visibility. Trigger: a recent scheduling failure or missed customer deadline that made leadership question the current tooling. Committee: Ops VP (champion), Plant Manager (user), IT Director (technical veto), CFO (approves above $25K). Disqualifier: companies already running a modern ERP with a scheduling module. Meridian Flow doesn’t replace those. In particular, it fills the visibility gap for companies without one.

2. Unique value proposition

For mid-market manufacturers running production on spreadsheets, Meridian Flow is the only scheduling platform that gets live floor visibility running in under two weeks with no IT project, so plant managers stop firefighting missed deadlines, without the six-month implementation their IT director keeps blocking.

3. Goals

Primary: $2.1M in new sourced opportunities by the end of Q4. Current run rate: $1.3M. Gap: $800K, targeted at the two verticals where the win rate is highest and the spend is lowest, automotive suppliers and industrial equipment. Supporting: 25% conversion from qualified marketing lead to qualified sales opportunity, 15% engagement rate across the named account list.

4. Channels and tactics

Channel Tactic Owner Cadence
Organic search Two bottom-of-funnel comparison and cost-of-delay pieces aimed at scheduling-software evaluation searches Content lead Monthly
LinkedIn, named accounts Campaigns against the named list in automotive and industrial equipment, savings calculator as the offer Demand gen Ongoing, reviewed fortnightly
Partner co-marketing Joint webinar with a non-competing adjacent vendor, shared attendee list Marketing and partnerships Once per quarter
Sales-triggered Case study sends to engaged named accounts, personalised by vertical Sales and marketing Weekly

5. Budget

$95K for the quarter. LinkedIn named accounts 35% ($33K), content production 25% ($24K), partner activity 20% ($19K), reallocation reserve 20% ($19K). Committed: $41K in tools and the retained content team. Movable: $54K.

6. Metrics

Leading, weekly: named-account engagement rate, qualified leads by vertical, calculator completion rate. Lagging, quarter end: sourced opportunities against $2.1M, win rate by source.

7. Timeline

Month 1: launch campaigns in both verticals, publish the first comparison guide. Month 2: mid-quarter checkpoint, move the reserve based on early vertical performance. Month 3: partner webinar, scale the winning channel, publish the second asset, quarter-end review.

8. Ownership and review

Owner: VP Marketing. Channel owners as listed above. Subsequently, leading indicators get reviewed every Monday in the opportunity meeting. Full revision at the mid-quarter checkpoint and again at quarter end. CRM data summarised against this page every Friday. Any channel more than 20% off target goes onto Monday’s agenda rather than waiting for the checkpoint.


Notice what makes this usable in a way a filled-in template usually isn’t. Every number ties to a real constraint. The disqualifier is as specific as the target. And the timeline has a decision built into it, not just a list of activities.

The One-Page Marketing Plan Template, Ready to Copy

Drop this into a doc, a Notion page, or a slide, and fill in the brackets. Keep to the line limits. The constraint is what makes it a one-page plan instead of a one-page summary of a longer plan you haven’t written.

COMPANY: [Name] | PERIOD: [Quarter/Year] | OWNER: [Name]

1. TARGET AUDIENCE (3-4 lines)
Firmographics: [employee range / revenue band / vertical]
Buying committee: [champion / user / technical veto / budget approval]
Trigger: [what has to be true for this to be urgent]
Disqualifier: [who looks like a fit but isn't, and why]

2. UNIQUE VALUE PROPOSITION (one sentence)
For [specific audience], [company] is the only [category] that
[mechanism], so [outcome], without [the tradeoff the alternatives force].

3. GOALS
Primary goal: [one number, one timeframe]
Current run rate: [number]
Gap: [delta, and where it comes from]
Supporting measures: [2-3 maximum]

4. CHANNELS AND TACTICS
| Channel | Specific tactic (not a category) | Owner | Cadence |
[3-4 rows maximum]

5. BUDGET
Total: [amount for the period]
Split by channel: [% or amount per channel above]
Committed vs movable: [locked / reallocatable mid-quarter]

6. METRICS
Leading, checked weekly: [2-3 indicators]
Lagging, checked at period end: [the primary goal]

7. TIMELINE
Month 1: [activities] -> Milestone: [checkpoint]
Month 2: [activities] -> Milestone: [checkpoint]
Month 3: [activities] -> Milestone: [checkpoint]

8. OWNERSHIP AND REVIEW
Plan owner: [name]
Channel owners: [name per channel row]
Review: [weekly check / mid-quarter revision / quarter-end rebuild]

Fill it in, then resist the urge to add a ninth section. If something doesn’t fit into these eight, it belongs in a supporting document. Namely a positioning brief, a channel playbook, a campaign outline. Not on the plan.

Six Mistakes That Turn the Page Back Into a Wish List

Five goals instead of one. The moment a plan has several co-equal primary goals, it stops working as a decision tool, because when two of them compete for the same budget, nobody knows which wins.

An audience definition broad enough to cover half the market. If your definition would also describe three competitors’ customer bases, it hasn’t constrained anything. The disqualifier line is what separates a real audience from an aspiration about market size.

Channels chosen because they’re normal. “We should be doing content, social, email, and paid” isn’t a channel strategy. It’s a list copied from every other company in your category, including the ones it isn’t working for.

Treating the page as a quarterly artifact. This is the single biggest reason one-page marketing plans fail at the same rate as the decks. A plan nobody has compared against actual performance since the kickoff isn’t a plan. It’s a memory of one.

No owner per channel. Ultimately, a line item with no name attached gets done last, every time.

Metrics that don’t trace back to the audience. Traffic and leads that don’t match section 1 will make the plan look healthy right up until the revenue doesn’t arrive.

Where the Page Goes From Here

A one-page marketing plan is not a document. It’s a habit that happens to have a document attached.

The teams this works for are the ones who put it on the wall, open it every Monday, argue about it in front of their CEO, and rewrite it when the evidence changes. The teams it doesn’t work for are the ones who build a beautiful page in January and treat the building as the achievement.

Admittedly, the format won’t do the second part for you. But it makes the first part cheap enough that there’s no good excuse left.

FAQ

How is a one-page marketing plan different from a marketing strategy?

A strategy document, firstly, explores options, research, and reasoning. It’s meant to be read once and referenced occasionally. The one-page plan is the output of that thinking, cut down to the decisions that get executed and tracked. Do the strategic work first if you need to. The page is what the team runs on afterwards.

How often should it be updated?

Check the leading indicators weekly, revise the page at a mid-quarter checkpoint, and rebuild it quarterly. Annual-only revision is too slow. After all, channel performance in B2B can change meaningfully inside a single quarter.

Can it work for a company with several products or segments?

Build one page per product or segment if they genuinely have different audiences, positioning, or channels. Don’t force several audiences onto one page. That’s exactly the vagueness the format exists to remove. If the segments share an audience and differ only by product, one page with a note in the channels section is enough.

What’s the biggest difference between a B2C and a B2B version?

The audience and channel sections. Consumer plans, including the original nine-square framework, assume one decision-maker and a short consideration period. A B2B plan has to account for a buying committee, a long cycle, and channels that match how business buyers research on their own before contacting anyone. Both the audience definition and the channel mix change substantially as a result.

Do I need special software to build one?

No. A doc, a slide, or a whiteboard works. The format matters more than the tool. Software earns its place in keeping the page current, pulling performance against the goals automatically instead of leaving someone to retype a document that’s already out of date.

Who should own the plan?

One person, named on the page. In smaller companies that’s usually the most senior marketer or the founder running marketing. In larger ones it’s the VP or head of marketing. Shared ownership sounds collaborative and reliably means the page belongs to nobody. Similarly, channel owners are different, and there should be one per line.

What if leadership keeps changing the goal mid-quarter?

Then the page is doing its job by making the change visible. Put the new goal on it, restate the gap, and show what has to come off the channel list to fund it. The problem isn’t leadership changing direction. It’s direction changing without anyone recalculating what it costs, which is how teams end up with three quarters of half-finished work and no explanation for the number.

What’s the most common reason a one-page marketing plan fails?

It gets built, presented, and never checked against reality again. That is the same failure as the long deck it replaced, and the format alone doesn’t fix it. The weekly check against section 6 is what turns the page into an execution tool instead of a better-looking artifact.

Marketing for Engineers: Why Your Technical Team Belongs in Sales and Marketing

Your best marketing asset is sitting in an engineering standup right now, and nobody has asked them to write a word.

This is the structural problem in industrial and technical B2B marketing. The people who understand the product are not in the room where the product gets explained. Consequently, the people writing the copy have to guess. And technical buyers — who spot a guess instantly — quietly disqualify you before anyone in sales knows they existed.

The fix is not “have engineering review the blog.” It is a defined operating role for technical people inside the marketing and sales process. Here is what that looks like, what it produces, and how AI changes the economics of it in 2026.

Why marketing for engineers is different from ordinary B2B marketing

Because your audience can audit you. In most B2B categories, vague copy is merely weak. In industrial, manufacturing, and deep-tech categories, vague copy is disqualifying.

A technical buyer reads your page the way a reviewer reads a paper. They are checking tolerances, units, standards, operating conditions, and integration constraints. A specification quoted without its conditions gets noticed immediately. So does a claim with no mechanism behind it. They notice hedging, too.

Three things follow from that:

  • Precision outperforms persuasion. A specific, correct, bounded claim converts better than an enthusiastic general one.
  • Omission reads as ignorance. If you describe a solution without naming the constraint it operates under, technical readers assume you do not know the constraint.
  • The buying committee is technical-led. Engineers may not sign, but they shortlist. Marketing that fails the engineer never reaches the person who signs.

This is why “marketing for engineers” is a genuine discipline, not a tone of voice. You are not writing at engineers in engineer-flavoured language. You are producing material that survives technical review.

What engineers actually contribute, role by role

Content creation: the source of the specifics

Technical content is hard to write well without technical grounding. Your audience, however, spots errors, misplaced information, and evasion immediately, and they read less charitably than a general business audience.

But the common failure is asking engineers to write. Most will not, and the drafts you get back read like documentation. The productive version is narrower:

Ask engineers for the specifics, not the prose. A twenty-minute interview yields the failure modes, the numbers, the “everyone gets this wrong” corrections, and the real-world constraints. A writer then turns that into the article. Engineering reviews for accuracy, not for style.

That division of labour is the whole trick. Engineers supply what only they have — the ground truth. Writers supply structure and clarity. Neither does the other’s job.

Lead qualification: better fit signals

Engineers can tell you which prospects your product genuinely suits, based on technical fit rather than firmographics alone.

This matters because most B2B lead scoring runs on company size, industry, and behaviour — none of which capture whether the product will actually work for that buyer. Instead, engineering can define the disqualifiers: the integration that will not work, the volume below which the economics fail, the regulatory environment that adds nine months.

Feed those into qualification and you stop spending sales time on deals that were never going to close on technical grounds. That is margin recovered, not just leads filtered.

Sales and marketing strategy: specification of the target

Engineers are used to writing specifications. A target account definition is, in fact, a specification.

They can help define which technical characteristics identify a good-fit company, which roles inside that company hold the real evaluation authority, and what the incumbent solution probably is. That produces a sharper target list than persona work built from job titles alone.

Sales support: the credibility multiplier

Once a deal is in technical evaluation, the challenge shifts from communication to fit — identifying the configuration that actually serves the buyer’s requirement.

Engineers in late-stage conversations do two things at once. Simultaneously, they solve the technical question and signal that your company takes the buyer’s problem seriously enough to send someone who understands it. Some manufacturers formalise this by moving engineers into sales engineering roles with commission attached.

The twenty-minute interview: what to actually ask

The interview is the whole system, so it is worth being precise about it. Most marketers waste the twenty minutes asking an engineer to explain the product, which produces a worse version of the datasheet. Ask instead for the things that never make it into documentation.

Open with the failure, not the feature. “What goes wrong when someone specifies this incorrectly?” An engineer will answer that question in detail, and the answer is usually the most useful paragraph in the finished article.

Five questions to work through after the opener

Then work through five more:

  1. “What do people consistently get wrong about this?” This produces the corrective content that ranks, because it is what buyers are searching for at 11pm when something is not working.
  2. “What is the number that actually matters here, and under what conditions?” Specifications quoted without their operating conditions are the single clearest signal to a technical reader that the writer did not understand the subject.
  3. “Where does our solution genuinely not fit?” Uncomfortable, and enormously valuable. It gives you honest comparison content, and it feeds the disqualifiers described above straight into qualification.
  4. “What does the buyer usually have in place already, and what breaks when they switch?” This is the migration and integration content nobody writes, and it is frequently the real reason deals stall.
  5. “If you were evaluating us, what would you want to see that we do not publish?” Engineers are buyers of other technical products. They know exactly what is missing.

Record it. Also, do not take notes — notes make you an editor while you should still be a listener, and the transcript is what makes everything downstream cheap.

One practical rule: never let the session become a review meeting. If the engineer starts correcting existing marketing material, note it and move on. Extraction and review are ultimately different jobs, and mixing them halves the output of both.

What this produces, in practical terms

Companies that make this work tend to see the same pattern:

  • Content that ranks and holds. Technically specific content attracts fewer visitors and converts far more of them, and it does not decay the way generic content does.
  • Shorter technical evaluation cycles. Questions get answered in the material instead of in a three-week email thread.
  • Fewer late-stage surprises. Technical disqualifiers surface early, when they are cheap.
  • Sales confidence. Reps stop hedging on technical questions because the answers exist in writing.

What a technical buyer checks before they contact you

It helps to know precisely what a page is being read for. Technical evaluators run a fairly consistent screen, largely unconsciously, and a page either survives it or gets closed.

What they check What passes What fails
Numbers A figure with its units, tolerance, and operating conditions stated A figure alone, or a range with no conditions
Claims A stated mechanism — why the result happens A superlative with nothing behind it
Constraints The limits named openly, including where it does not apply Constraints omitted, which reads as not knowing them
Standards The specific standard, revision, and scope of compliance “Compliant with industry standards”
Comparisons Like-for-like, with the test conditions given A comparison against an unnamed “typical” competitor
Authorship A named engineer or a technical reviewer credited Anonymous, or a brand byline

None of that requires better writing. Consequently, it is entirely achievable — every row on that list is satisfied by having asked an engineer the right question and then not smoothing the answer away in the edit.

The last row is worth dwelling on. Attribution has become a genuine ranking and credibility signal, and it costs nothing: put the engineer’s name on the page as the technical source. It makes the content harder to dismiss, it makes the engineer more willing to participate next time, and it is the one thing a competitor cannot copy.

The objection: engineers do not have time for this

This is the real constraint, and it is legitimate. After all, engineering time is the scarcest resource in most technical companies, and marketing is not going to win the argument for a standing share of it.

So do not ask for a standing share. Structure the ask so it is small, bounded, and clearly worth it:

  1. Interview, don’t assign. Twenty minutes of an engineer’s time, recorded, produces more usable material than a writing task they will not complete.
  2. Batch it. One session per quarter per engineer, covering several topics, beats a recurring monthly meeting nobody defends.
  3. Review only for accuracy. Give them a specific question — “is anything here wrong?” — not an open request for feedback. Open requests produce rewrites; specific ones produce corrections.
  4. Show them the result. Engineers who see their explanation become the page that sourced a real deal will make time for the next one.

How AI changes this in 2026

Here is the part that has genuinely shifted, and it is the reason this article needed rewriting.

The bottleneck in technical marketing was never ideas. It was converting scarce engineering knowledge into published material fast enough to matter. One interview used to yield one article, weeks later.

Recently, that constraint has moved. A recorded twenty-minute engineering conversation now becomes the raw material for a technical article, a spec-comparison page, a set of FAQ answers, sales-enablement notes, and the objection-handling language for outreach — from the same source session.

Two cautions, because this is where most companies get it wrong:

AI does not replace the engineer. It removes the transcription-and-drafting cost of using the engineer. If you skip the interview and let a model generate technical content unsupervised, you produce exactly the plausible, unbounded, specification-free copy that technical buyers reject. You will have automated the failure.

Accuracy review becomes more important, not less. Naturally, faster drafting means more surface area for errors to hide in. The engineering review step is the one part of the process that must not be compressed.

Here is the practical shape of it: engineer supplies ground truth → AI handles the volume conversion → engineer reviews for accuracy → publish. The scarce input stays scarce and human. Everything downstream of it gets cheap.

That is the difference between AI-decorated marketing and AI-integrated marketing. Decorated means a model wrote it and nobody checked. Integrated means the model multiplies a human expert whose knowledge was previously trapped in their head.

How to start in the next two weeks

You do not need a programme. You need one loop, run once, to prove it works.

Week one. Pick the single question your sales team gets asked most in technical evaluation — a marketing audit will surface it if you are not sure. Meanwhile, book twenty minutes with the engineer who answers it best. Record the conversation. Ask them what people get wrong, what the real constraints are, and what number matters most.

Week two. Turn that recording into one article. Send it back to the engineer with one question: is anything here inaccurate? Fix what they flag. Then publish. Give it to sales as an answer they can send directly.

Then measure whether it gets actually used — in search, and in deals. If it does, book the next interview. That is the entire programme, and it compounds.

Frequently asked questions

What does “marketing for engineers” mean?

It has two senses. The first is marketing aimed at engineers as buyers — content that survives technical scrutiny. The second is involving your own engineers in marketing as subject-matter sources. In practice they are the same discipline, because the second is how you achieve the first.

Should engineers write the content themselves?

Usually not. Interview them and have a writer produce the draft, then have the engineer review for accuracy only. Writing assignments given to engineers tend not to get completed, and when they do the output usually needs heavy structural editing.

How much engineering time does this realistically take?

Roughly twenty minutes per topic for the interview, plus fifteen minutes for accuracy review. Batched quarterly, that is a few hours a year per engineer for a substantial content library.

How do you get engineers to agree to participate?

Ask for their expertise, not their writing. Keep the ask bounded and specific. Then show them the result and what it produced — engineers respond to evidence that the effort mattered.

Can AI write technical content without engineering involvement?

It can produce content that reads plausibly and fails technical review. Language models generate confident, unbounded claims, which is precisely what technical buyers screen for. AI is highly effective at multiplying an expert’s input and poor at substituting for it.

Does this apply outside industrial manufacturing?

Yes. It applies wherever the buyer can evaluate your claims — medical devices, scientific instruments, developer tools, infrastructure software, cybersecurity, and industrial manufacturing. Anywhere the audience knows more than the marketer, this is the operating model.

The short version

Your engineers hold the specifics that make technical marketing work, and technical buyers will not accept marketing without them. The old constraint was that extracting and publishing that knowledge cost more than most companies would spend.

That constraint is gone. What remains, therefore, is the decision to build the loop: interview, draft, verify, publish — and run it often enough to compound.

StepUp builds AI-integrated marketing operations for industrial and technical B2B companies — including the content systems that turn engineering knowledge into pipeline. Let’s talk about what that looks like for your team.

Content Marketing vs. Inbound Marketing – Can They Be Compared?

Last updated: June 27, 2026

Most B2B companies — especially in industrial sectors like manufacturing, cleantech, and engineering services — still rely on cold outreach, trade show badge scans, and a sales team grinding through purchased contact lists. It works, until it doesn’t. Until your reps burn out, your cost per lead climbs quarter over quarter, and the buyers you actually want have already shortlisted a competitor before your SDR even picks up the phone.

That’s the shift inbound content marketing was built for.

At StepUp, we run full marketing departments for global B2B companies — often with a single person orchestrating AI-powered workflows that replace entire teams. We’ve watched industrial manufacturers go from zero organic pipeline to six-figure deals sourced entirely through content. Not because they wrote more blog posts, but because they built an inbound engine designed around how their buyers actually research, evaluate, and purchase.

This guide breaks down exactly how inbound content marketing works in B2B, why it matters more now than ever, and how to build a strategy that turns your expertise into a pipeline machine — with specific frameworks, real examples, and the AI-accelerated playbook we use with our own clients.

Key Takeaways

  • Inbound content marketing combines content creation with a system — content is the fuel, and the inbound methodology (Attract → Convert → Close → Delight) is the engine that turns it into pipeline.
  • It compounds; outbound doesn’t. A well-optimized guide published today still generates leads 18 months from now. A cold email campaign, however, does not survive the week.
  • B2B companies don’t need bigger teams — they need a smarter architecture. AI-accelerated workflows let one experienced marketer produce the output of an entire department, without sacrificing quality.
  • The biggest gap isn’t content creation — it’s the system around it. Most B2B companies publish content with no conversion path, no lead scoring, and no sales alignment. That’s where the returns leak away.
  • First-mover advantage is real, especially in industrial verticals. Most competitors still rely on trade shows and cold calls. Therefore the company that builds an inbound engine now owns the digital landscape for years.

On This Page

What Is Inbound Content Marketing?

Inbound content marketing is the practice of creating and distributing valuable, relevant content that attracts your ideal buyers to you — rather than interrupting them with ads, cold calls, or unsolicited emails.

The concept merges two disciplines:

  • Inbound marketing — a methodology coined by HubSpot that centers on earning attention by being genuinely helpful at every stage of the buyer’s journey.
  • Content marketing — the strategic creation of content (articles, videos, guides, tools) that educates, informs, or solves problems for a defined audience, as defined by the Content Marketing Institute.

When you combine them, you get a system: content is the fuel, and the inbound methodology is the engine. Every piece of content serves a specific purpose — attracting strangers, converting visitors into leads, nurturing leads into customers, and turning customers into advocates.

For B2B companies, especially those selling complex, high-ticket products or services (industrial equipment, engineering solutions, enterprise software), inbound content marketing is particularly powerful because:

  • Sales cycles are long. Your buyers spend weeks or months researching before they talk to sales. According to Gartner research, B2B buyers spend only 17% of the total purchase journey meeting with potential suppliers — the rest is independent research and internal discussion. Content fills that window.
  • Buying committees are large. A single piece of content can influence the engineer, the procurement manager, and the VP simultaneously — each consuming different formats at different stages.
  • Trust is non-negotiable. In industrial B2B, you’re not selling a $29/month SaaS tool. Instead, you’re selling a six- or seven-figure commitment. Buyers need to trust your expertise before they’ll even take a call.

Inbound content marketing, therefore, builds that trust at scale, 24/7, without adding headcount.

Inbound Marketing vs. Outbound Marketing

The distinction matters because most B2B companies don’t need to abandon outbound — they need to stop depending on it exclusively.

Inbound Outbound
Approach Pull — earn attention by being useful Push — interrupt with your message
Tactics Blog posts, SEO, gated guides, email nurture, social thought leadership Cold calls, cold emails, paid ads, trade show booths, purchased lists
Cost trajectory Compounds — content appreciates over time Linear — stops the moment you stop spending
Buyer experience Buyer initiates on their terms Seller initiates, often unwelcome
Best for Long sales cycles, complex products, educated buyers Immediate pipeline, new market entry, time-sensitive offers
Trust building High — demonstrates expertise before the ask Low — trust must be built after first contact

Here’s what we see with our industrial B2B clients: outbound still works for named-account plays and event-driven campaigns (a new product launch, a trade show follow-up). But the companies that build sustainable, scalable pipeline — the ones where marketing actually drives revenue — are the ones that layer inbound content on top.

The compounding effect is real. A well-optimized guide you publish today will still generate leads 18 months from now. A cold email campaign from 18 months ago? It’s in the trash. Research from the HubSpot State of Marketing Report consistently shows that inbound leads cost significantly less than outbound leads over time, precisely because of this compounding dynamic.

The smartest B2B teams don’t choose one or the other. They use inbound content to warm the market, then use outbound to accelerate deals with accounts that have already engaged with their content. That’s the hybrid model, and it outperforms either approach in isolation.

Content Marketing vs. Inbound Marketing: How They Work Together

This is a source of confusion that costs B2B companies real money.

Content marketing is a discipline — the practice of creating content to attract and retain an audience. You can do content marketing without an inbound strategy (plenty of companies publish blogs that go nowhere because there’s no conversion path, no nurture sequence, and no alignment with sales).

Inbound marketing is a methodology — a framework for how to attract, engage, and delight customers. You can do inbound marketing without content (technically), but you’d be trying to run an engine without fuel.

Here’s how they fit together:

  • Content marketing provides the assets. Blog posts, whitepapers, videos, case studies, calculators, comparison guides.
  • Inbound marketing provides the system. How those assets are mapped to buyer stages, how they capture leads, how leads are scored and routed to sales, how customers are retained and activated as advocates.

When a manufacturing company publishes a technical guide on “How to Evaluate Industrial Coating Systems” — that’s content marketing. When that guide is optimized for search, gated behind a form that triggers a lead score update in HubSpot, followed by a nurture sequence that delivers three more relevant pieces of content before alerting a sales rep — that’s inbound content marketing.

The gap we see most often: B2B companies invest in content creation but skip the system. They have great engineers who could write authoritative technical content, but no strategy connecting that content to pipeline. The 2024 B2B Content Marketing report by CMI and MarketingProfs found that only 29% of B2B marketers consider their organization’s content marketing to be very or extremely successful — often because content exists without an inbound system around it. Inbound content marketing closes that gap.

The Inbound Content Marketing Framework: Attract → Convert → Close → Delight

The inbound methodology breaks the buyer’s journey into four stages. Each stage, however, requires different content types, different calls to action, and different success metrics.

Stage 1: Attract — Turn Strangers Into Visitors

Goal: Get your ideal buyers to find you when they’re researching problems you solve.

Key channels: SEO, social media (especially LinkedIn for B2B), industry publications, guest posts.

Content types that work in B2B:

  • Educational blog posts targeting informational keywords your buyers search. For an industrial manufacturer, this might be “challenges of marketing engineered products” or “how to generate leads for custom fabrication.”
  • Thought leadership on LinkedIn — not corporate announcements, but genuine perspectives from your subject matter experts on industry trends.
  • Video explainers breaking down complex technical concepts that your buyers need to understand before they can evaluate solutions.
  • Industry trend reports that position your company as the one tracking where the market is heading.

What most B2B companies get wrong at this stage: They write about themselves. “We’re excited to announce our new product line.” Nobody is searching for that. Attract-stage content answers the questions your buyers are already asking — before they know you exist.

AI acceleration: At StepUp, we use AI workflows to identify content gaps at scale — analyzing what your ideal buyers search for, what your competitors rank for, and where the whitespace is. What used to take a content strategist two weeks now takes two hours.

Stage 2: Convert — Turn Visitors Into Leads

Goal: Capture contact information from visitors who’ve engaged with your attract-stage content.

Key mechanisms: Landing pages, forms, calls to action (CTAs), gated content offers.

Content types that drive conversion in B2B:

  • Gated guides and whitepapers — in-depth resources that deliver enough value to justify an email address. “The Complete Guide to Selecting an Industrial Coating Vendor” is worth a form fill. “5 Marketing Tips” is not.
  • Assessment tools and calculators — interactive content that gives the buyer something personalized. “Calculate Your Cost Per Lead by Channel” or “Assess Your Manufacturing Marketing Maturity.”
  • Webinar recordings — live events that generate leads during promotion, then continue converting as on-demand content.
  • Case studies with specific results — “How [Company] Reduced Customer Acquisition Cost by 40% in 12 Months” earns a download because the buyer wants to see if the results are replicable.

Conversion Mechanics: What Actually Turns Traffic Into Leads

  1. CTAs embedded in blog posts — not generic “Contact Us” buttons, but contextual offers. A post about industrial marketing challenges should therefore offer a guide on solving those challenges.
  2. Landing pages with a single focus — one offer, one form, no navigation distractions.
  3. Progressive profiling — don’t ask for 12 fields on the first form. Ask for email and company. Next download, ask for role and company size. In this way you build the profile over multiple interactions.
  4. Lead scoring — not all leads are equal. A VP of Engineering who downloaded your pricing comparison guide is worth more than a student who downloaded your glossary. Score accordingly.

HubSpot tip: If you’re running HubSpot (and if you’re a B2B company in Israel or targeting global markets, you should be — it’s the backbone of most inbound operations we build), use smart CTAs that change based on what the visitor has already downloaded. Returning visitors see the next logical offer, not the same ebook they already have.

Stage 3: Close — Turn Leads Into Customers

Goal: Nurture qualified leads until they’re ready to buy, then hand them to sales at the right moment.

Key mechanisms: Email nurture workflows, lead scoring thresholds, sales enablement content, CRM integration.

Content types that close deals in B2B:

  • Email nurture sequences — automated workflows that deliver relevant content based on what the lead has engaged with. Not “checking in” emails. Value-delivery emails.
  • Comparison guides — “HubSpot vs. Salesforce for Industrial B2B” or “In-House Marketing Team vs. Outsourced Marketing Department.” Help buyers make the decision they’re already trying to make.
  • ROI calculators and business cases — give the internal champion the numbers they need to sell your solution to their CFO.
  • Customer case studies with hard metrics — at this stage, the buyer wants proof. Not testimonials. Results. “Increased qualified pipeline by 280% in 9 months” moves deals forward.
  • Sales enablement decks and one-pagers — content your sales team can use in conversations that reinforces the same messaging the buyer encountered in your content.

The handoff that most companies botch: Marketing generates a lead. Lead gets dumped into a CRM. Sales calls immediately. Lead isn’t ready. Sales marks it as “bad lead.” Marketing blames sales. Sales blames marketing.

Inbound content marketing fixes this with lead scoring and service-level agreements (SLAs). Marketing agrees to deliver leads that meet specific criteria (score threshold, company fit, engagement pattern). Sales agrees to follow up within a specific timeframe with a specific approach. The content strategy is designed to move leads toward that score threshold before the handoff.

Stage 4: Delight — Turn Customers Into Advocates

Goal: Deliver such a great experience that customers renew, expand, and refer.

This is the stage most B2B companies ignore entirely, and it’s a mistake — especially in industrial sectors where the buyer community is small and tightly networked.

Content types that delight:

  • Onboarding sequences — structured content that helps new customers get maximum value from your product or service in the first 90 days.
  • Customer-only resources — exclusive guides, templates, or tools that make their job easier.
  • Community and user groups — forums or events where customers connect with peers and your team.
  • Proactive check-in content — “Here’s what’s changed in your industry this quarter and what it means for your strategy.” Not a sales pitch. Genuine value.
  • Co-created case studies — featuring your customers’ success stories elevates them as thought leaders in their own right. They love it. Their network sees it. Referrals follow.

The flywheel effect: Delighted customers create attract-stage content for you. Their testimonials become blog posts. Success stories turn into case studies. Meanwhile, referrals arrive as warm leads that skip the top of funnel entirely. HubSpot’s shift from the traditional funnel to the flywheel model reflects exactly this dynamic — customers aren’t the end of the process; they’re the engine that accelerates it.

Types of Content Used in Inbound Marketing

Not all content is created equal, and not all content belongs at every stage. Here’s a practical breakdown of the content types that actually move the needle in B2B inbound, mapped to where they work best.

Blog Posts and Articles

Stage: Attract Purpose: SEO entry points that answer the questions your buyers are asking. B2B best practice: Write for specificity. “Digital Marketing for Manufacturers” outperforms “Digital Marketing Tips” because it speaks directly to your ICP. Technical depth beats generic advice every time.

Long-Form Guides and Whitepapers

Stage: Convert Purpose: Gated assets that deliver enough value to earn an email address. B2B best practice: Make them genuinely useful — not thinly disguised sales pitches. The best-performing whitepapers we’ve seen in industrial B2B are ones that the reader’s engineering team actually references in their work.

Video Content

Stage: Attract + Convert Purpose: Explainers, product demos, customer stories, thought leadership. B2B best practice: Short-form (under 3 minutes) for LinkedIn and attract. Long-form for deep dives that support conversion. In manufacturing, factory tours and process explainers perform exceptionally well because they showcase capability in a way text can’t.

Email Sequences

Stage: Convert + Close Purpose: Automated nurture that delivers the right content at the right time. B2B best practice: Segment by industry, role, and engagement level. A procurement manager at a manufacturing company needs different content than a CTO at a SaaS startup.

Case Studies

Stage: Close + Delight Purpose: Social proof with measurable results. B2B best practice: Structure as Problem → Approach → Results. Lead with the metric. “280% increase in qualified pipeline” in the headline, not buried on page three.

Interactive Tools

Stage: Convert Purpose: Assessments, calculators, configurators that deliver personalized value. B2B best practice: These are underused in industrial B2B and massively effective. A “Marketing Maturity Assessment” that scores a manufacturer on their digital presence and gives specific recommendations generates leads and qualifies them simultaneously.

Webinars and Live Events

Stage: Attract + Convert Purpose: Thought leadership delivered live, then repurposed as on-demand content. B2B best practice: Co-host with a complementary partner (your HubSpot agency + an industrial trade publication = audience overlap with your exact ICP).

Social Media Content (LinkedIn)

Stage: Attract Purpose: Distribution channel for your content + direct thought leadership. B2B best practice: In B2B, LinkedIn is the platform. Personal profiles outperform company pages by a wide margin in engagement. Equip your CEO and subject matter experts with content to share — not corporate press releases, but genuine perspectives.

How to Build an Inbound Content Marketing Strategy: A Step-by-Step Playbook

Here’s the exact framework we use at StepUp to build inbound content engines for B2B companies — from zero to pipeline-generating machine.

Step 1: Define Your ICP (Ideal Customer Profile) With Painful Specificity

Generic personas don’t work. “Marketing managers at mid-size companies” is useless. You need:

  • Industry: Manufacturing, industrial equipment, cleantech, engineering services — be specific.
  • Company size: Revenue range, employee count, number of locations.
  • Decision-maker profile: Title, reporting structure, KPIs they’re measured on, tools they use.
  • Pain points: Not “wants to grow revenue.” What specific friction do they experience? “Can’t generate qualified leads because their technical content doesn’t rank, and their sales team wastes 60% of their time on unqualified prospects from trade shows.”
  • Buying triggers: What events cause them to search for a solution? New product launch, competitor pressure, leadership change, failed internal initiative.

Why this matters for content: Every piece of content you create should speak to a specific ICP. If you sell to both manufacturing companies and SaaS startups, they need separate content tracks.

Step 2: Map the Buyer’s Journey for Your Specific Market

For every ICP, document:

  • Awareness stage: What problems are they searching for? What questions do they ask colleagues? What industry publications do they read?
  • Consideration stage: What solutions are they evaluating? What criteria do they use? Who else is involved in the decision?
  • Decision stage: What final objections do they have? What proof do they need? What does their internal approval process look like?

In industrial B2B, this journey is often 6-12 months. Your content strategy needs to sustain engagement across that entire timeline — not just spike at the top of funnel.

Step 3: Conduct a Content Gap Analysis

Before creating anything new, audit what you have and what’s missing:

  1. Inventory existing content. Blog posts, case studies, datasheets, videos, presentations that live on your website or in sales folders.
  2. Map existing content to journey stages. You’ll almost certainly find you have plenty of bottom-funnel content (product pages, datasheets) and almost nothing at the top (educational content that attracts new visitors).
  3. Analyze competitor content. What are they ranking for? What topics do they cover? Where are the gaps they haven’t filled?
  4. Identify keyword opportunities. Use tools like Semrush to find the exact terms your buyers search for — and how difficult they’ll be to rank for.

AI acceleration: We use AI-driven analysis to process competitor content, identify semantic gaps, and generate topic clusters in hours instead of weeks. The goal isn’t to create AI-generated content (more on that below) — it’s to use AI to do the strategic analysis faster and smarter so humans can focus on creating genuinely valuable content.

Step 4: Build Topic Clusters Around Pillar Themes

Random blog posts don’t build authority. Clusters do.

A topic cluster is a pillar page (comprehensive guide on a broad topic) surrounded by cluster content (focused articles on subtopics) that all interlink. This approach, originally popularized by HubSpot’s research team, has become the standard for building topical authority in search.

Example for a manufacturing marketing cluster:

  • Pillar: “The Complete Guide to Digital Marketing for Manufacturers”
  • Cluster content:

Each cluster piece ranks for its own long-tail keywords and passes authority to the pillar. The pillar ranks for the broader term. Together, they establish your site as the definitive resource on that topic.

Step 5: Create a Content Calendar With Conversion Paths

For each piece of content, define:

  • Target keyword(s)
  • Buyer journey stage
  • ICP segment
  • Content format (blog, video, guide, etc.)
  • CTA / conversion path — what’s the next step for the reader? Download a guide? Book a consultation? Watch a demo?
  • Distribution plan — how will this content reach its audience? SEO alone? LinkedIn? Email to existing contacts? Paid promotion?

Publish consistently. For most B2B companies, 2-4 high-quality pieces per month beats 12 mediocre ones. Quality compounds. Quantity without quality creates noise.

Step 6: Set Up the Technology Stack

Inbound content marketing requires infrastructure:

  • CMS: Where content lives (WordPress, HubSpot CMS).
  • Marketing automation: Email workflows, lead scoring, form management (HubSpot is the standard for mid-market B2B — it’s what we deploy for most clients).
  • CRM: Where leads are tracked and handed to sales (HubSpot CRM, Salesforce).
  • Analytics: Google Analytics 4, Google Search Console, Semrush for keyword tracking.
  • AI tools: For content research, brief generation, repurposing, and analysis — not for writing finished content, but for accelerating every step around the writing.

The integration point that matters most: Your CMS, marketing automation, and CRM must be connected. When a visitor reads a blog post, downloads a guide, and then visits your pricing page — that behavior sequence should be visible to your sales team in real time. That’s the difference between a content program and an inbound engine.

Step 7: Launch, Measure, Iterate

No inbound strategy survives first contact with reality unchanged. Launch with your best hypothesis, then let data refine it.

Measuring Inbound Content Marketing: The Metrics That Actually Matter

Vanity metrics — page views, social shares, subscriber counts — feel good but don’t pay the bills. Here are the metrics that connect inbound content to revenue:

Traffic Metrics (Leading Indicators)

  • Organic traffic growth — month over month, tracked at the cluster level, not just total site traffic.
  • Keyword rankings — are you moving up for your target terms? Track positions weekly, since movement there predicts traffic.
  • New vs. returning visitors — healthy inbound programs show a strong mix. New visitors mean your attract content is working. Similarly, returning visitors mean your nurture content is engaging.

Conversion Metrics (Pipeline Indicators)

  • Visitor-to-lead conversion rate — what percentage of visitors become known contacts? B2B benchmark: 1-3%. Top performers: 5%+.
  • Landing page conversion rates — by offer. Which gated assets actually earn form fills?
  • Lead-to-MQL conversion rate — what percentage of leads meet your qualification criteria?
  • MQL-to-SQL conversion rate — of qualified leads, how many does sales accept?

Revenue Metrics (Business Outcomes)

  • Pipeline sourced by content — total opportunity value where first touch or last touch was inbound content.
  • Revenue attributed to inbound — closed-won deals traced back to content interactions.
  • Customer acquisition cost (CAC) by channel — how does inbound compare to outbound, paid, events?
  • Time to close — leads nurtured through content typically close faster because they arrive educated and pre-sold.

The Reporting Cadence That Works

  • Weekly: Keyword rankings, traffic trends, content published vs. planned.
  • Monthly: Conversion rates, lead volume, MQL/SQL handoff metrics.
  • Quarterly: Pipeline attribution, CAC by channel, content ROI, and adjustments to the marketing goals you set at the start.

HubSpot reporting advantage: If your CMS, marketing automation, and CRM all live in HubSpot, attribution reporting is built in. You can trace a closed deal back to the blog post that first brought the contact to your site 8 months ago. Ultimately, that visibility is what makes inbound content marketing defensible to your CFO.

The AI-Accelerated Inbound Playbook: How We Do It at StepUp

Here’s what’s changed in the last two years, and why it matters for B2B companies evaluating inbound content marketing in 2026.

Notably, AI hasn’t replaced the need for inbound content marketing. It’s amplified the advantage for companies that do it well — and widened the gap for those that don’t.

What AI Accelerates

  • Research and analysis. Competitive gap analysis, keyword clustering, buyer persona development — tasks that used to take weeks now take hours.
  • Content brief generation. AI can analyze top-ranking content, identify structural gaps, and generate detailed briefs that human writers use as a starting point.
  • Content repurposing. One long-form guide becomes 10 LinkedIn posts, 5 email snippets, a video script, and a slide deck — with AI handling the first-draft transformation.
  • Personalization at scale. Dynamic email content, smart CTAs, and segment-specific messaging that would have required a team of five.
  • Reporting and optimization. Pattern recognition across thousands of data points to identify what’s working and what’s not.

What AI Does Not Replace

  • Subject matter expertise. Your engineers, your founders, your customer-facing team — they have knowledge that no AI model possesses. The best inbound content in industrial B2B comes from extracting that expertise and packaging it for your buyers.
  • Strategic judgment. Which topics to prioritize, how to position against competitors, when to gate vs. ungate — these decisions require human understanding of your market.
  • Relationship building. Content earns trust, but humans close deals.

The StepUp model: We run full marketing departments for global B2B companies using AI-powered workflows orchestrated by a single experienced marketer. This isn’t about replacing people with bots — it’s about giving one exceptional person the leverage of an entire team. The output quality stays high because the human drives strategy and quality control. The speed and volume increase because AI handles the operational heavy lifting.

For industrial B2B companies, this model is particularly powerful. Admittedly, you likely don’t need (and can’t afford) a 10-person marketing team. But you absolutely need the output of one — consistent content, running campaigns, nurturing leads, reporting on results. Consequently, AI-accelerated inbound makes that possible.

Common Inbound Content Marketing Mistakes in B2B (and How to Avoid Them)

After building inbound programs for dozens of B2B companies across industrial, tech, and professional services sectors, here are the failure patterns we see most often:

Mistake 1: Writing for search engines instead of buyers. SEO matters, but if your content reads like it was written to satisfy an algorithm, your buyers will bounce. Google’s own helpful content guidelines emphasize creating people-first content. Write for the human first. Optimize for search second.

Mistake 2: No conversion path. A blog post without a CTA is a dead end. Every piece of content should have a logical next step for the reader.

Mistake 3: Skipping the middle of the funnel. Most companies have top-of-funnel blog posts and bottom-of-funnel product pages. The middle — comparison guides, case studies, assessment tools — is where leads actually convert.

Mistake 4: Treating all leads equally. A student downloading your guide is not the same as a VP of Operations at a target account downloading your guide. Without lead scoring and segmentation, your sales team wastes time on unqualified leads and loses faith in marketing.

Mistake 5: Giving up too early. Inbound content marketing is not a 90-day experiment. In truth, it takes 6-12 months to build meaningful organic traction. As a result, companies that quit at month four miss the compounding curve that makes the whole model work.

Mistake 6: No sales alignment. If marketing and sales aren’t aligned on what constitutes a qualified lead, what the handoff process looks like, and what content sales needs to close deals — the entire system breaks down.

Getting Started: The First 90 Days

If you’re a B2B company considering inbound content marketing — especially if you’re in manufacturing, industrial, or engineered products — here’s what the first 90 days should look like:

Days 1-30: Foundation

  • Define your ICP with specificity
  • Audit existing content
  • Set up (or configure) HubSpot for marketing automation, lead scoring, and CRM
  • Conduct keyword research and competitive analysis
  • Build your first topic cluster map

Days 31-60: Launch

  • Publish your first pillar page
  • Create 2-3 cluster blog posts
  • Build your first gated offer (guide, assessment, or template)
  • Set up your first email nurture workflow
  • Begin LinkedIn distribution

Days 61-90: Optimize

  • Analyze early traffic and conversion data
  • Refine CTAs based on click-through rates
  • Publish 4-6 more cluster pieces
  • Launch a second nurture workflow for a different segment
  • Align with sales on lead scoring thresholds and handoff SLA

By day 90, you won’t have a fully mature inbound engine — but you’ll have the infrastructure in place, your first content compounding in search, and early data to refine your strategy.

The Bottom Line

Inbound content marketing isn’t a tactic. It’s a fundamental shift in how B2B companies build pipeline — from chasing buyers to attracting them. From renting attention through ads and cold outreach to owning attention through content that compounds over time.

For industrial and manufacturing B2B companies, the opportunity is enormous — and largely untapped. Your competitors are still relying on trade shows and cold calls. The companies that invest in inbound content marketing now will own the digital landscape in their verticals for years to come.

So the question isn’t whether inbound content marketing works for B2B. That data is settled. What remains open is whether you’ll build the engine before your competitors do.

If you’re ready to explore what an AI-accelerated inbound content marketing program looks like for your business — one person, full marketing department output, pipeline results in months instead of years — let’s talk.

Frequently Asked Questions

Is inbound marketing the same as content marketing?

No. Content marketing is the practice of creating material your buyers actually want — guides, videos, case studies. Inbound marketing is the wider methodology that decides what gets created, where it sits in the buyer’s journey, how someone moves from reading to converting, and what happens after they do. Content is the fuel. Inbound is the engine it runs in.

Can you do content marketing without inbound marketing?

You can, and most B2B companies do — which is why so much good writing produces nothing. Publishing without conversion paths, lead handling and a follow-up sequence means you are paying for traffic and letting it leave. The reverse is not possible: there is no inbound programme without content to attract people in the first place.

How long does inbound content marketing take to work in B2B?

Expect early signals — search impressions, engaged sessions, first conversions — within three to four months. Meaningful pipeline usually lands between months six and twelve, because B2B buying cycles are long and organic authority compounds slowly. Anyone promising qualified pipeline in six weeks is describing paid acquisition, not inbound.

Is inbound marketing still effective now that AI generates so much content?

More effective, but the bar moved. Volume is no longer a differentiator, because anyone can produce it. What earns attention now is the thing a model cannot generate on its own: your engineers’ actual knowledge, your real customer numbers, your point of view about the category. Use AI to compress the work around that — research, structure, first drafts, repurposing — and keep the substance human.

What does inbound marketing cost for a B2B company?

The real cost is time and consistency rather than software. A functional programme needs someone accountable for it, a publishing rhythm you can hold for a year, a CMS and a CRM you already own, and enough subject-matter access to make the content worth reading. Companies that fail at inbound almost never fail on budget — they fail because it was nobody’s actual job.